How to cite: Manea, M., Manea, V.C., 2024, Computational Geodynamics Laboratory: 15 years of numerical modelling and high-performance computing at the Centro de Geociencias, Universidad Nacional Autónoma de México: Revista Mexicana de Ciencias Geológicas, 41(1), 130-144, DOI: 10.22201/cgeo.20072902e.2024.1.1773.
REVISTA MEXICANA DE CIENCIAS GEOLÓGICAS
v. 41, núm. 1, 2024, p. 103-144
DOI: http://dx.doi.org/10.22201/cgeo.20072902e.2024.1.1773
Computational Geodynamics Laboratory: 15 years of numerical modelling and high-performance computing at the Centro de Geociencias, Universidad Nacional Autónoma de México
Marina Manea and Vlad C. Manea
Computational Geodynamics Laboratory, Instituto de Geociencias, Universidad Nacional Autónoma de México, Campus Juriquilla, Querétaro, 76230, Mexico.
* marina@geociencias.unam.mx
ABSTRACT
The rapid development of computer technology in the last decades provided scientists with new opportunities to expand their research fields and in the same time to compress the necessary time to obtain research based scientific conclusions. This fast tendency also significantly affected the scientific discovery trend, and in many research fields we observe a transition from standard laboratory experiments to numerical experiments. In the particular research field of Earth Sciences, computational modeling constitutes a powerful predictive tool that fills a geological and geophysical data gap. The geological record covers well the Earth’s surface but is quite limited in depth, whereas geophysical information can provide depth-based information but it is limited in time to present day. Therefore, there is a large data gap in time and space that cannot be covered unless some indirect and intuitive prediction method is used. In this picture, numerical simulations come as an essential research tool. In this work, we provide a review about the research progress obtained in the last 15 years using high-performance computing at the Computational Geodynamics Laboratory at the Centro de Geociencias, Universidad Nacional Autónoma de México.
Keywords: Computational geodynamics; numerical modeling, supercomputing.
RESUMEN
El rápido desarrollo de la tecnología informática en las últimas décadas brindó a los científicos nuevas oportunidades para expandir sus campos de investigación y, al mismo tiempo, comprimir el tiempo necesario para llegar a conclusiones científicas basadas en la investigación. Este rápido desarrollo también afectó significativamente la tendencia del descubrimiento científico, y en muchos campos de investigación, observamos una transición desde los experimentos de laboratorio estándar hacia los experimentos numéricos. De una manera particular, en el campo de las Ciencias de la Tierra, el modelado computacional constituye una poderosa herramienta predictiva que llena un vacío de datos geológicos y geofísicos. El registro geológico cubre bien la superficie de la Tierra, pero tiene una profundidad bastante limitada, mientras que la información geofísica puede proporcionar información basada en la profundidad, pero tiene un intervalo de tiempo limitado a los eventos actuales. Por lo tanto, existe una gran brecha de datos en el tiempo y el espacio que no se puede cubrir a menos que se utilice algún método de predicción indirecto e intuitivo. En este panorama, las simulaciones numéricas se presentan como una herramienta de investigación esencial. En este trabajo brindamos una revisión sobre los avances en investigación obtenidos en los últimos 15 años utilizando computación de alto rendimiento en el Laboratorio de Geodinámica Computacional en el Centro de Geociencias, Universidad Nacional Autónoma de México.
Palabras clave: geodinámica computacional; modelación numérica; supercómputo.
Manuscript received: August 15, 2023
Corrected manuscript received: January 5, 2024
Manuscript accepted: January 15, 2024
INTRODUCTION
Since the discovery of Plate Tectonics in the 1960’s, a continuously trend of discovery is observed in Earth Sciences. In this context, for many decades, geologists and geophysicists intended to reveal the origin of key geodynamics processes that occur in the interior and on the surface of the Earth. Whether we discuss about small or large-scale processes alike, earth scientists need to expose hidden structures beneath the surface. Moreover, they need to offer a reasonable dynamic picture about how what we observe today originally formed. In this narrative, collecting all sorts of data proved to be only the first step. Rapidly, scientists discovered that without a geodynamic perspective, interpretation of the collected data is incomplete. In order to fill this gap, research studies start to propose different hypotheses that can explain distinct, first order, observations. However, in many occasions these hypotheses tend to become quite different if not even contrasting or opposed, and a vital necessity to independently test these hypotheses become reality. In this setting, a new discipline came to rescue in the hybrid form of computing and mathematical modeling, a discipline that is called computational geodynamics. Although many processes can be modeled analytically (Turcotte and Schubert, 2002), the vast majority of the observed tectonic processes (i.e., mantle convection, subduction, etc.), are controlled by forces that non linearly depend on a complex rock rheology and structure. Computational geodynamics (Gerya, 2009, 2019) harnesses the power of computers, numerical codes and observational data that provide a physical understanding of the processes that shape the surface of the Earth and other celestial bodies alike.
Mexico, from the geodynamics point of view, represents a unique natural laboratory where a number of five tectonic plates interact (Figure 1) (Pardo and Suarez, 1995; Gomez-Tuena et al., 2003; Ferrari, 2004; Perez-Campos et al., 2008; Ferrari et al., 2012). Characterized by an extreme diverse tectonic setting, Mexico provides a real opportunity to investigate remarkable processes that can push the envelope of our knowledge in terms of Earth formation and evolution. This was the fundamental basis for developing a powerful computational infrastructure able to offer the possibility to investigate in a feasible time-frame first-order geodynamic processes (Espindola et al., 2000; Perez-Campos et al., 2008; Bandy et al., 2011). When weeks or even months of dedicated computing is necessary to solve a numerical problem, the need of more computational power becomes essential. Presently, the maximum speed for a single CPU is limited to 4 GHz, or in some extreme cases to 5 GHz. This is primarily related with the exponential consumption of energy (and temperature increase) beyond a certain clock speed. The technical solution to overcome this serious obstacle came from parallel computing, which consists in using multiple CPUs and/or GPUs in parallel to share the computational work.
Based on this background, almost 15 years ago, the authors of this paper laid the foundations of the Computational Geodynamics Laboratory at the Centro de Geociencias (CGL-CGEO)- Universidad Nacional Autónoma de México (UNAM), designing the first supercomputer in Mexico dedicated for numerical simulations in geodynamics. In this paper, we present first the architecture of parallel computing machine, or high-performance computing cluster (HPCC), available for the CGL-CGEO, and then we will review some of the main scientific achievements obtained using this computational infrastructure. Also, in the end we present the current state of high-performance computing and visualization at the UNAM, Campus UNAM Juriquilla.
Figure 1. Global view of present-day tectonic plates. In Mexico, there is a number of five tectonic plates that interact which other: R-Rivera, CO-Cocos, P-Pacific, NA-North America and CA-Caribbean. Other notations are: JF – Juan de Fuca, SA – South America, N – Nazca, A - Antarctica. Jigsaw black curve represent trenches. Red line segments show mid ocean ridges. Black arrows depict plate movements, and gray oval show the location of so called “flat slabs” in Mexico and South America (image adapted from Manea et al., 2017).
EARTH RHEOLOGY, GEODYNAMIC MODELS AND THE NEED FOR HPCC
In this chapter, we will discuss the Earth rheology and how the modeling of long-term geodynamics processes generated the need for HPCC. The rheology of tectonic plates and upper mantle represents a key ingredient for any numerical simulation. On Earth, most of the rocks behave nonlinear from a rheological point of view, with the exception of salt rock (Carter et al., 1993; Jackson and Hudec, 2017). For example, rocks’ viscosity depends on a series of main parameters like temperature, pressure, strain-rate, grain size, mineralogy, fluid content and other parameters (Kohlstedt, 2007; Karato et al., 2013; Gerya, 2019). The flow law (1) and the viscosity formulation (2) are shown below:
(1)
(2)
where, Є. Strain rate σ differential stress, A is a constant, n is the stress exponent, d is grain size, p is the grain size exponent, COH is water fugacity, r is the water fugacity exponent, ϕ is melt fraction, α is a constant, E is the activation energy, V is the activation volume, R is the gas constant, T is absolute temperature and η is effective viscosity (Hirth and Kohlstedt, 1996, 2003).
Earth lithosphere and mantle have different rheology laws. For example, the upper mantle is characterized by dislocation creep whereas lower mantle is controlled by diffusion creep (Kohlstedt, 2007). However, this seems to be questioned recently (e.g., Bioli et al., 2017). Moreover, the upper crust, oceanic or continental, at low temperature behaves brittle and is characterized by the formation of a complex faulting system depending on the level of stress (Gerya, 2019). In order to capture numerically this brittle behavior a high resolution is needed in the order of a couple of kilometers or better.
Therefore, the system of equations that jointly describes movement (equations (3) and (4)) and heat transport (equation (5)) becomes also non-linear:
(3)
(4)
(5)
(6)
Where, ρ is density, g is acceleration gravity, and volume forces are represented by gravitational forces, σij the deviatoric stress tensor, P is pressure, η is effective viscosity , ui is the i the component of the velocity, uj is the j the component of the velocity, and xi, xj represent partial derivative with respect to the spatial coordinate, where t is the time, Cp is heat capacity, k is the variable thermal conductivity which depends of pressure, temperature and rock composition, Q is the heat generation from different sources (Gurnis et al., 2004; Gerya, 2019; Strak and Shellart, 2021).
Currently, there are several main types of geodynamical numerical models aim to investigate Earth evolution. Each model has several main advantages and limitations. For example, steady-state numerical models whose purpose is to explore a thermal structure of a specific study region or type of tectonic process (i.e., subduction), imply a subduction geometry that is already well known and is also fixed in time. In 2D, these models, irrespective of the numerical method used (i.e., finite differences or finite elements) can be currently performed in a reasonably time period on a desktop workstation of even on a personal computer (Figure 2). However, increasing the model domain to 3D, a more powerful computing system might be required, especially for high resolution models (i.e., for the numerical resolution of few kilometers in each direction).
Other models are coupled kinematic-dynamic, where a part of the modeling domain has a prescribed boundary condition (i.e., imposed velocity on top of the model domain), whereas the rest of the model evolves freely in time. These models are in general time-dependent large-scale models that integrate many millions of years of geological evolution at both regional and global scales, and require significant computational recourses for both 2D and 3D (Figure 3).
The most challenging models are fully dynamic. They are time-dependent and for each time step a large number of parameters are solved, as for example temperature, pressure, viscosity, stress and strain-rates. Similarly, with coupled kinematic-dynamic models, these 2D or 3D simulations also require vast amounts of computational recourses in terms of processors, RAM and storage space (Figure 4).
Resembling realistic conditions and using well constrained parameters in geodynamic simulation is a difficult task that requires large amounts of computational recourses in order to obtain predictions in viable time-frames. Regional or global mantle convection studies are possible due to modern parallel computing systems. Depending on the specific geodynamics problem, including more complex thermo-chemical convection simulations, several tens of million finite element grid points are necessary. Additionally, hundreds of millions of particles in cells (PICs), or tracers, are used to advect materials in high resolution global convection simulations. For such large models, a significant amount of memory (hundreds of Gigabytes) and processing power is needed (hundreds of GFLOPs) (Oeser et al., 2006).
Most numerical computer codes represent a series of statements that are executed one at a time, or serial. In the case of geodynamical numerical simulations, in many occasions, parts of the code takes a long time to finish, and the rest of the code is idle until that part is completed. Currently, the programing approach to make the codes run faster is through parallelization, where the same parts of the computer code are performed simultaneously for different nodal points, finite elements, or markers. One of the numerical parallelization strategies include domain decomposition, where the computational domain is divided in different regions that hold the same number of finite elements or computing nodes. Then, a certain number of processors are allocated for each domain region. Computing cores interchange information along the common lateral boundaries using the message passing interface (MPI) protocol, which represents one form to exchange information between multiple computing cores or servers running a parallel code across distributed memory (Clarke et al., 1994). For example, CitcomS code uses this strategy for both full spherical and regional models. For example, for a regional model assigning 4 processors in latitude direction, 4 processors in longitude direction and 4 processors, or computing cores, in vertical directions (depth), a total of 64 computing cores are required (Figure 5). If we double the number of computing cores in each direction, then the total number of cores necessary to perform such simulation is 8×8×8=512. This is a significant amount of computing cores that can be achieved only by using a HPCC system.
At the Centro de Geociencias-UNAM, in 2007 a first prototype of the Horus-HPCC was developed. It was composed of a number of four 4-cores computing nodes, one head node and one small Gbit switch, and the head node was also used as storage node. The prototype was composed of a total number of 16 computing cores, 32 GB of RAM and only one 500 GB storage drive. The cluster software package used was the open-source ROCKS 4.0 (http://www.rocksclusters.org) that provided the necessary flexibility and efficiency in the deployment and management of Linux (CENTOS based) clusters (Figure 6).
Our choice for this open-source software for the cluster management was based on two principles. First, ROCKS was completely free and also offered a well-maintained community-based forum for helping to deploy a HPCC system. Second, in 2007 the majority of Rocks based HPCC systems were in the Supercomputing Top 500 (https://www.top500.org), which presents the 500 most powerful parallel computer systems in the world. Based on several lines of funding from PAPIIT-UNAM (Support Program for Research and Technological Innovation Projects) as well as CONACYT (National Council for Science and Technology) research projects, the Horus-HPCC evolved in time, and in 2010 was already a robust system able to offer computing resources for frontier research topics (Figure 7). Additionally, this pioneered system was also used for teaching numerical geodynamics, and providing computing resources at different graduate levels, both undergraduate and graduate (MSc and PhD), and also used by various research groups from the UNAM, Campus Juriquilla.
We benchmarked the Horus-HPCC in order to measure its performance. In our case, we opted for benchmarking the cluster using the parallelized CitcomS software that it is known to scale well on hundreds or even thousands of processors (Tan et al., 2006). We measured the performance variation against calculation input parameters that might affect performance such as number of finite elements, or grid resolution, used in a single simulation, and the number of computing cores. We monitored for each simulation the wall time, the actual time the simulation runs for a specific number of predefined time steps. We ran all benchmark simulations for 100 numerical timesteps, which proved adequate for the onset of mantle convection in full spherical global simulations. The results of this benchmark can be used two-fold. First, we wanted to see how well the Horus-HPCC performs using realistic modeling conditions, and second, we aimed to understand how future numerical simulations scales to allow the end-user to request the correct amount of resources (i.e., computing cores). For this specific benchmark we considered a thermo-chemical convection problem performed within a full spherical shell domain. We used mesh resolutions that varied from coarse to fine, as 12×9×9×9, 12×17×17×17, 12×33×33×33, and 12×65×65×65 grid nodes, where, 12, represents the total number of caps or regions used to reassemble the full spherical shell, and the rest of three numbers (i.e., 33×33×33), represents the number of grid points in latitude and longitude directions and in depth. Each simulation was performed with 12, 48, and 96 computing cores respectively and used ~60 million particle tracers to track the chemical changes inside the Earth’s mantle. Figure 8 presents the benchmark results and we clearly observe a large increase in wall time with the mesh size, and a decrease of computation time with the augment of the number of computing cores. Using 96 processors, the simulation with the highest resolution finishes in ~4 hours, much less than ~28 hours when using just 12 computing cores. In our view, this was a good result that showed that the low-cost medium size Horus-HPCC system offered a suitable research-based performance and full-spectrum operational scale without a massive development team, excessive add-ons or increased processing costs. It is worth mentioning that the entire system design and architecture, as well as its full implementation and testing was carried out exclusively by the authors of the paper and that their primary research field is geophysics and geodynamics.
Figure 2. An example of a 2D computational domain used of thermal modeling of a subduction zone. A grid with 12000 triangles with ~ 2 km mesh resolution used to solve the numerical thermal models. The circular red region represents a potential spherical blob made of partially molten rocks that moves towards the surface through the mantle wedge flow. The FEM discretization for the blob is shown enlarged as a green spherical mesh. 3000 finite elements were used to solve the heat transfer equation inside this circular region. Mesh is generated with PDE2D (www.pde2d.com), a general-purpose finite element program that solves partial differential equations in 1D, 2D and 3D (image adapted from Manea et al., 2005).
Figure 3. An example of a 3D global spherical computational domain (a) and surface mesh. 12 such regional domains (b) recompose the full spherical domain. Numerical mesh is generated with CitcomS (www.geodynamics.org), a parallelized opensource finite element code for large scale geodynamic models (Tan et al., 2006; Zhong et al., 2000; McNamara and Zhong, 2004; Moresi et al., 2014). Result of a thermochemical convection simulation is shown in c), where the temperature is shown as isosurfaces. Velocity field is shown as temperature-colored vectors. The large orange sphere in the center depicts the Earth’s metallic core.
Figure 4. An example of a high-resolution 3D cartesian computational domain (808 km × 392 km × 264 km) used in visco-elasto-plastic fully dynamic simulations. Below it is shown a close view of the numerical mesh. Numerical mesh is generated with I3ELVIS (Gerya and Yuen, 2007), a parallelized finite different code for large scale geodynamic models. Additionally, for faster and more efficient computation a multigrid method is employed where several meshes coarser than the original fine mesh are used in order to obtain a better convergence rate (Gerya, 2019). The final numerical is shown in term of temperature and composition in figure 14.
Figure 5. 3D view of spherical domain decomposition of a regional domain (performed with CitcomS) for parallel computation (1 radian × 1 radian × 2000 km). In total a number of 64 computing cores are used for this simulation (labeled CPU0 … CPU63). Each colored block depicts one modeling region processes by a single computing core. Top figure shows a lateral view and bottom figure is taken from the top view. At the lateral frontiers the computing cores interchange information using the message passing interface (MPI) protocol. The MPI represents a form to exchange information between multiple computing cores or computers running a parallel code across distributed memory (Clarke et al., 1994).
Figure 6. HPCC – Horus at the Geosciences Center – UNAM. Some of its main characteristics were (as per 2010): 188 computing cores (AMD-based), 500 GB of RAM, 2×15 TB RAID 5 storage DAS (Direct Attached Storage), Primary (30 kVA) and secondary (2 kVA) UPS units, and a redundant cooling system.
MAIN RESEARCH OUTCOMES PERFORMED USING HORUS-HPCC
Since the Horus-HPCC system passed successfully the benchmark experiments, we proceeded to perform numerical simulations for various frontier research themes. Although many research topics were investigated using this system, here we present merely selected several main research achievements, some of them successfully published in high impact journals.
One of the first research achievements obtained using the Horus-HPCC was a study related with the Mexican subduction zone (Figure 9). In this study (Manea and Manea, 2011) we used the updated slab geometry of the Cocos plate as revealed by the Middle America Seismic Experiment (MASE) (Clayton et al., 2007) to obtain the thermal structure beneath Guerrero state. The new high resolution thermal model was obtained using the finite elements based PDEs solver PDE2D (www.pde2d.com). This thermal model (Figure 10) together with phase diagrams for sediments, hydrated basalt and lithospheric mantle, predict the existence of several dehydration pulses along the slab interface that corelate well with the location of non-volcanic tectonic tremors (NVTs) recorded beneath Guerrero (Payero et al., 2008). The main result of this research endorses the hypothesis that NVT bursts localized above the flat slab segment in Mexico represent the indication of continuing continental crust hydration with fluids expelled from slab dehydration.
Figure 7. Main hardware configuration of Horus-HPCC system at CGEO-UNAM.
Figure 8. HPCC-Horus benchmark for a full spherical thermo-chemical convection simulation performed with CitcomS (Tan et al., 2006; Zhong et al., 2000; McNamara and Zhong, 2004; Moresi et al., 2014). In the upper right corner inset shows the thermal convection pattern (subsurface) and visualization was performed with open-source software Paraview (www.paraview.org).
Figure 9. 3D view of the Mexican subduction zone shown as bathymetry and topography. White slab contours indicate depths to the slab surface based of Pardo and Suárez (1995) and Perez-Campos et al. (2008). Band cut through the topographic surface relief is located above the flat-slab in Central Mexico where we performed 2D thermomechanical simulation of subduction using the finite elements based PDEs solver PDE2D (www.pde2d.com). (Figure taken from Manea and Manea, 2011).
Figure 10. 3D view of subduction in Central Mexico and the Cocos slab temperature inferred from numerical modeling. Arrows on the slab surface represent the locations where the slab experiences dehydration. The background image cut through the continental crust is the resistivity model of Jodicke et al. (2006). (Figure taken from Manea and Manea, 2011).
Pyroclastic flows are one of the most lethal volcanic hazards produced as a result of lava dome or eruption column collapse. The flows are a heterogenous mix of hot lava blocks, pumice, ash and volcanic gas, and travel rapidly down volcanic slopes following preferentially topography depressions as valleys or ravines. Therefore, any volcanic hazards assessment takes into consideration the actual topography for each individual active volcanic edifice, and quantification of the influence of digital elevation model (DEM) resolutions is a requirement for an adequate hazard evaluation. Using Horus-HPCC and the parallelized numerical code TITAN2D (Pitman et al. 2003; Patra et al. 2005), Capra et al. (2011) tested the influence of different DEM resolutions (5, 10, 30, 50, and 90 m) of Colima volcano for past block-and-ash flows at Colima volcano and show that a rigorous hazard assessment for pyroclastic flows can be achieved if a DEM resolution of 10 m or better is used (Figure 11). The best simulation times were obtained using between 16 and 32 Horus-HPCC computing cores independent of the DEM resolution.
In one of the subsequent studies using Horus-HPCC, we expand the research area to Chile (Figure 12) where a similar flat slab subduction process takes place and it is still not well understood (Manea et al., 2012). Here, the numerical experiments are designed to reproduce the development of the Chilean flat slab and are developed using the three-dimensional (3-D) finite element code CitcomS (Tan et al., 2006). In this work, it is demonstrated for the first time that trenchward motion of thick cratons may result in flat subduction.
The 3D numerical experiments performed with Horus-HPCC show that as the craton approaches the trench the suction between ocean and continent increases, favoring slab flattening. In the particular case of the Chilean flat slab, we demonstrated that trenchward motion of the 200–300 thick lithosphere currently located at ~700–800 km away from the Peru-Chile Trench, reproduced well the slab geometry, and in the same time predicted a consistent temporal and spatial evolution of volcanism in the region (Figure 13).
Some of the modeling trends in the recent years are based on joining independent data sets with model prediction in order to investigate a specific process. This was the case in the year 2014 where after several years for numerical modeling performed with Horus-HPCC, geochemistry data was combined with modeling predictions in order to explain some unusual volcanic centers (Manea et al., 2014). Evidence shows that the geochemistry of volcanic rocks (enrichment of boron (B/Zr)) erupting above subducted oceanic fracture zones indicate that fluid inputs to arc magma sources are possibly higher than normal. Using high-resolution 3D coupled petrological-thermomechanical numerical simulations of subduction performed with the modeling code I3ELVIS (Gerya and Yuen, 2007), which uses a marker-in-cell method and a multigrid solver, we show that enhanced production mantle wedge melts distinctly concentrate in areas where serpentinized oceanic fracture zones are subducted (Figure 14). It is worth mentioning that there is a quite competitive research international environment and without the Horus-HPCC that offered unconstrained access to computational resources, this work would not have been possible in a timely manner.
Figure 11. 3D view of the La Lumbre ravine at the Colima volcano, Mexico and numerical simulation results for pyroclastic flow depth estimations performed with the parallelized numerical TITAN2D (Pitman et al. 2003; Patra et al. 2005) for different DEM resolutions. Figure taken from Capra et al. (2011).
Figure 12. 3D view of Nazca and South American plates showing contours of depth in kilometers to Wadati-Benioff zone (Syracuse and Abers, 2006). Red, blue, and white arrows are present plate velocities (V) along the Peru-Chile Trench and of Nazca (NAZ) and South American (SAM) plates East-west transparent strip shows modeled area. Other notations are: CR—Carnegie Ridge, CHR—Chile Ridge. Image adapted from Manea et al. (2012).
Figure 13. Numerical simulation performed with the parallelized finite elements code CitcomS and shows the evolution of temperature field beneath Central Chile (Manea et al., 2012). Other notations are: FA—Farellones Arc, AA—Aconcagua, CT—Cerro de las Tortolas, C—Calingasta, VH—Vacas Heladas, CB—Cerro Blanco, P—Precordillera, SP—Sierras Pampeanas. Figure adapted from Manea et al. (2012).
Figure 14. 3D simulation of subduction where temperature and composition are shown after 17.5 Myr of numerical time integration. The numerical experiment is performed using the parallelized finite difference visco-elasto-plastic geodynamic modelling code I3ELVIS of Gerya and Yuen (2007). Green strip in the middle of the oceanic plate represents the serpentinized fracture zone, and partially molten mantle above the slab is colored according to the temperature. Figure adapted from Manea et al. (2014).
FUTURE OF HIGH-PERFORMANCE COMPUTING AT UNAM CAMPUS JURIQUILLA
For geodynamic modeling single-core processing is slowly becoming outdated, while parallel codes are developed replacing previous serial solutions to achieve higher performance. This year Horus-HPCC celebrates 15 years of existence, and it is time to retreat after a long period of long-lasting usage. Its main purpose now it is not research oriented but rather teaching oriented where students can immerse into an HPC world for better understanding. However, the experience gained for planning, building and exploiting Horus-HPCC proved to be valuable. In 2015 an innovative initiative related with high performance computing and scientific data visualization started to take shape, this time at UNAM, Campus Juriquilla level. Building a more powerful system was an obvious choice, but we wanted to integrate as much as possible more of the improvement ideas suggested by our colleagues during Horus-HPCC usage. Considering the present and future needs of our scientific community, the novel approach was not entirely HPCC centered, but rather embedded in a broader concept that tightly integrated data visualization with parallel computing. We observed that an increasing amount of data is produced using parallel computer simulations. While high-resolution large-scale simulations can be performed by increasing the number of computing cores or adding more fast storage to the current HPCC systems, efficiently visualization of such large data sets proved to be a real limitation. In the data interpretation flow, visualization is a key tool for understanding and gaining intuitive insight into the spatial structure of 3D dynamic (time-dependent) modeling results. One relatively fast and short-term solutions were to visualize, for example, only a small part of a 3D model, taking the advantage that the computational domain was already divided by the number of computing cores. For example, for a global simulation of thermochemical mantle convection problem, one can visualize only one region instead of the entire model (Figure 15). However, in this case, the dynamics of the global process is difficult to estimate entirely even if it is performed by individual parts. Therefore, large-scale parallel visualization (i.e., high-resolution tiled display walls) systems are becoming a real necessity (Molnar et al., 1994; Crockett, 1997). Moreover, virtual reality (VR) offers even a more powerful manner to better harness modeling results. Therefore, for a more robust and efficient scientific advance of our scientific community we decided to center the future development by providing a powerful rendering framework but strongly coupled with HPCC. Based on this viewpoint in 2015 the National Laboratory for Advanced Scientific Visualization (LAVIS, www.lavis.unam.mx) came to reality (Figure 16).
The focal idea centered around LAVIS is to accelerate science discovery by a state-of-the-art hardware and software framework that enables scientists to generate high resolution models, better extract meaning, explore more data and enable the use of high-fidelity visualization machines to see more detail from their experiments. For high-resolution 2D visualization LAVIS offers a large (7.2 m × 3.5 m) 55 million pixels parallel display unit. It consists of a 6×4 array of high-resolution displays connected to a GPU cluster.
Figure 15. Visualization of a global thermochemical simulation performed with CitcomS. a) Green surface represents global mantle temperature isosurface (T=0.5). The outlined region on top of the model shows a limited part of the model shown in b). b) Red metallic surface represents the Earth’s outer core. The green surface represents the local mantle temperature isosurface (T=0.5). Visualization was performed with open-source software Paraview (www.paraview.org).
Figure 16. The National Laboratory for Advanced Scientific Visualization (LAVIS) building (www.lavis.unam.mx) located in the Campus Juriquilla, UNAM, Mexico.
This is a robust system implemented in many research facilities at both, academia and industry levels (Humphreys and Hanrahan, 1999; Correa et al., 2002; Blue Brain Project, 2016). This approach allows users to render efficiently large models by dividing the screen into multiple tiles and rasterizing the entire frame in a per-tile basis (Figure 17).
VR is an important method to visualize and interact with modeling results. LAVIS offers a CAVE (Cave Automatic Virtual Environment) type virtual reality environment, and consists of a large cube-shaped room in which the front and lateral walls as well as the floor are specially designed projection screens. A motion-tracking technology and stereoscopic displays create an immersive virtual reality environment for one or more users simultaneously, and the entire room is maintained in dark when in use. Additionally, the headgear used by the main user is synchronized with all projectors, and the 3D model appear to float in the middle of the CAVE room (Figure 18). The entire system is powered by a high-end graphic workstation from where data is loaded, and images are simultaneously rendered in all four projectors. The immersive-interactive LAVIS CAVE system is used for a wide range of disciplines, including neurobiology, engineering, medicine, geology, planetary sciences, mathematics, meteorology, and physics, and offers students and researchers alike an entirely new dimension of scientific experimentation (Manjrekar et al., 2014).
The third visualization system at LAVIS is an Earth Simulator system that is based on an inside-projection onto an acrylic glass sphere of 1.5 m in diameter from two high-resolution projectors (Figure 19). The entire optical system is based on a special convex mirror assemblage. It is used for interactively visualizing dynamic processes such as plate tectonics, climate change, and the surface topography of other planetary bodies. Also, the Earth Simulator is used to present research results to the general public, as various type of numerical simulations. Exhibits or other events, as public conferences, outreach events, benefit from the Earth Simulator as a powerful device designed to enhance informal education and public perception about science. In the near future the Earth Simulator will be combined with an omnidirectional high-resolution video camera and used as a potential symmetrical 360° video communication system (Li et al., 2019).
Figure 17. The 55 million pixels high-resolution tilled display at National Laboratory for Advanced Scientific Visualization (LAVIS) (www.lavis.unam.mx).
Figure 18. The CAVE VR immersive system at National Laboratory for Advanced Scientific Visualization (LAVIS) (www.lavis.unam.mx).
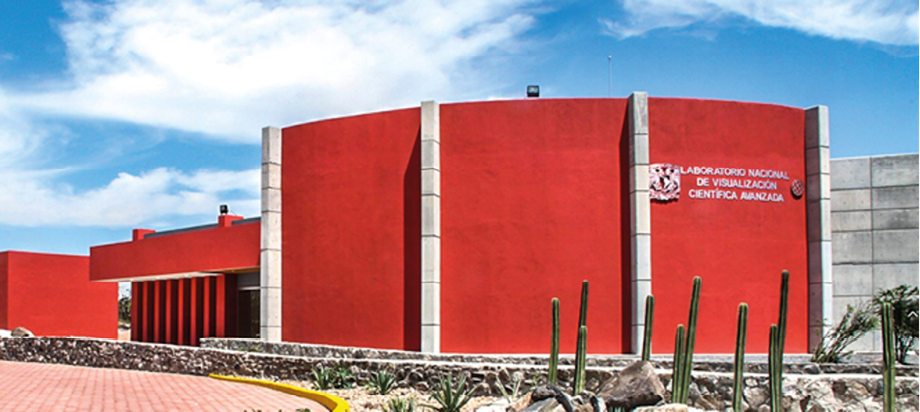
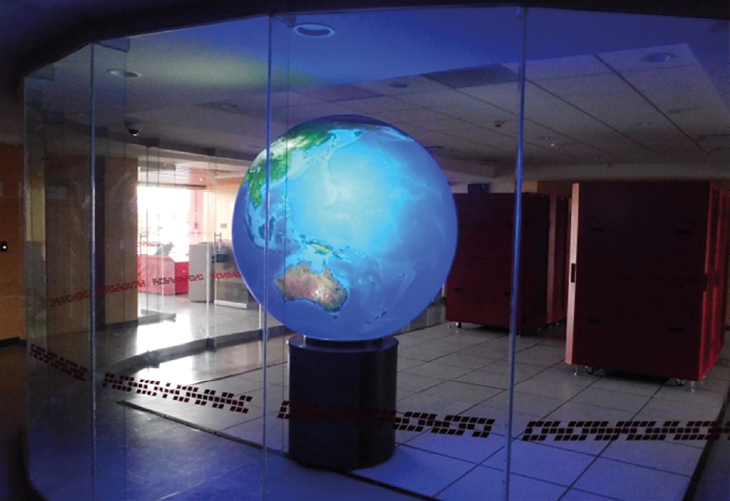
Figure 19. The Earth simulator spherical projection system at National Laboratory for Advanced Scientific Visualization (LAVIS) (www.lavis.unam.mx).
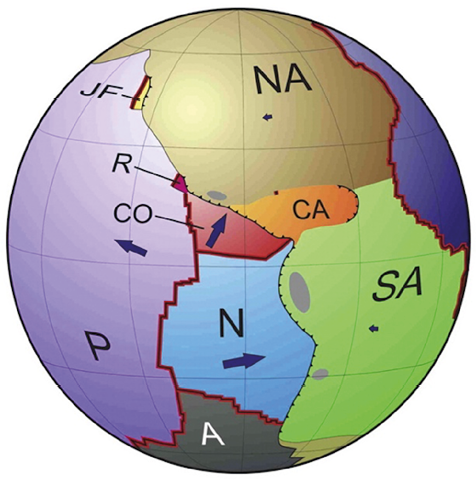
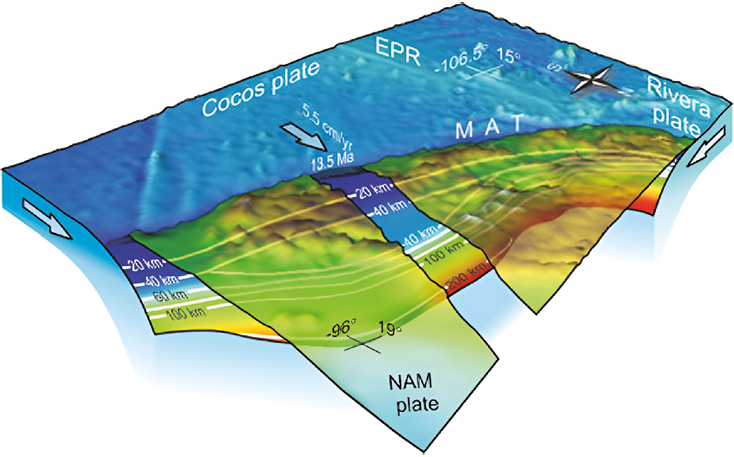
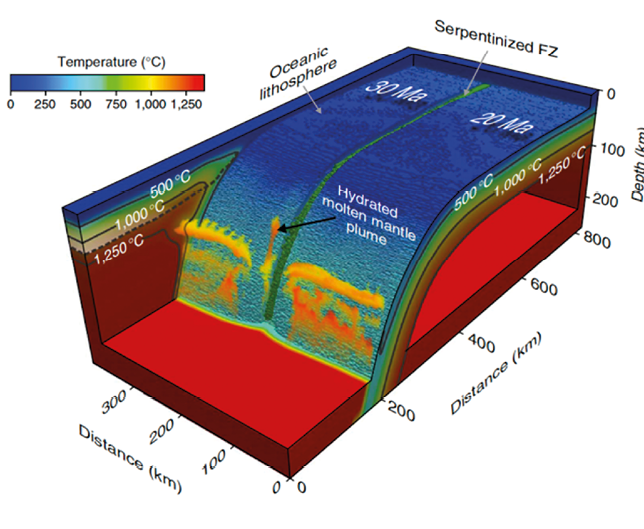
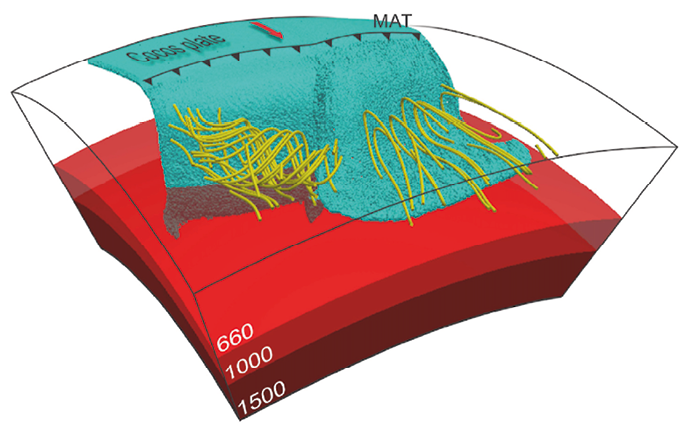
Virtual reality, massive data, and interactive research is rapidly growing and generating great expectations. At UNAM, Campus Juriquilla, future research will be to integrate the entire visualization and supercomputing infrastructure into an environment that allows researchers to work collaboratively, even when such users are geographically dispersed even on different continents. Users can process, share, discuss and interact with vast amounts of simulation data in real time, and LAVIS-UNAM has all the components to do this in the foreseeable future. Using this top computing infrastructure was used to produce high-resolution 3D numerical experiments specifically designed for the Mexican subduction zone. Moreno and Manea (2021) investigate the influence of a large continental block, the Chortis Block, on the evolution of subduction in Mexico and Central America. The results show realistic subduction geometries that are consistent with seismic tomography images for the region located beneath the North America Plate, where the Cocos slab is double flat, at shallow depths and in the mantle transition zone. Moreover, modeling results predict an upper mantle flow pattern consistent with seismic anisotropy observations (Figure 20), where for the Mexican subduction mantle shear wave anisotropy shows fast polarization directions oriented roughly in the direction perpendicular to the Middle America Trench (MAT). On the other hand, fast polarization directions are oriented mainly parallel to the MAT beneath Central America, which is consistent with modeling predictions (Figure 20).
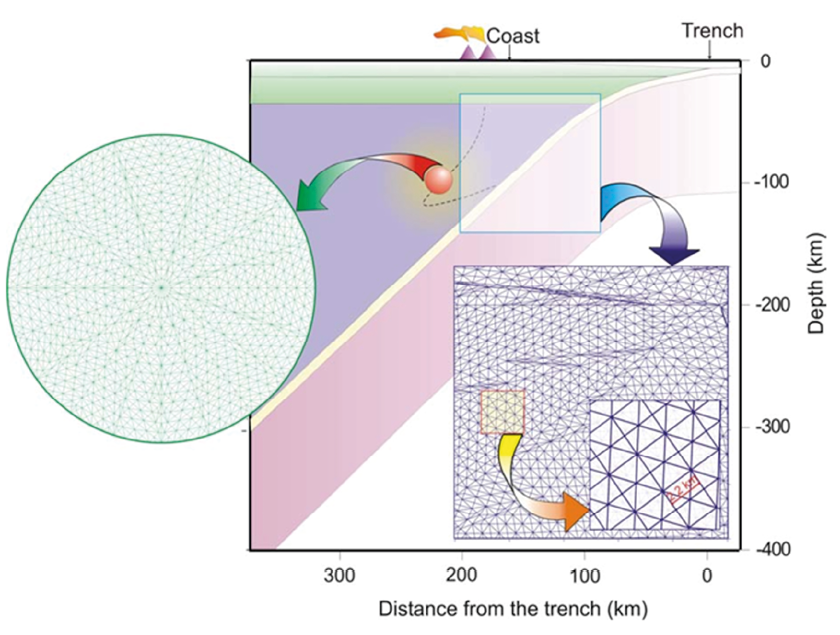
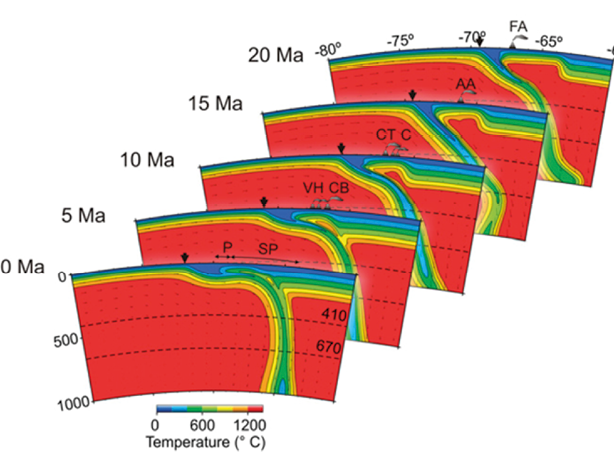
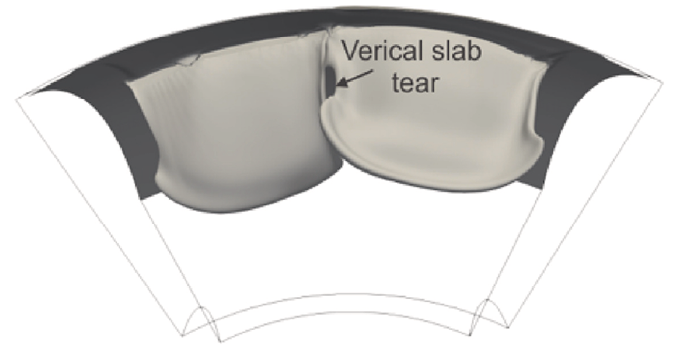
In the same line with the previous study, Nava-Lara and Manea (2022) took advantage of the LAVIS computing and visualization infrastructure and use 3D geodynamical time dependent regional kinematic models to investigate the origin of a possible vertical slab tear recently discovered beneath southern Mexico from seismological observations. Modeling results predict that vertical slab tearing is achieved only when a low viscosity linear discontinuity is introduced in the Cocos plate (Figure 21). This result is consistent with previous studies that proposed the existence of a mechanically weak zone in the oceanic lithosphere beneath the Tehuantepec fracture zone.
In this paper we review briefly the computational infrastructure developed at the Centro de Geociencias UNAM, Campus Juriquilla, in the last 15 years. It describes the history of the design and construction of Horus-HPCC, a parallel computing machine designed to perform large parallel simulations in different research fields specific for geosciences. We also show some of the main research results obtained using HPCC-Horus. In the end we present the current state of high-performance computing and visualization at the UNAM, Campus Juriquilla, UNAM, and explain some of the future trends for development in order to maintain the research at a high standard and solve frontier scientific problems.
Figure 20. 3D regional time-dependent numerical simulation performed with the parallelized finite elements code CitcomS (Tan et al., 2006) and shows the evolution of slab (shown as magenta-colored particles) beneath Southern Mexico and Central America (Moreno and Manea, 2021). Yellow tubes represent mantle flow streamlines. MAT – Middle America Trench. Visualization was performed with open-source software Paraview (www.paraview.org).
Figure 21. 3D regional time-dependent numerical simulation performed with the parallelized finite elements code CitcomS (Tan et al., 2006) and shows the formation of a vertical slab tear (shown as grey-colored temperature isosurface, Tadim.= 0.5) beneath Southern Mexico and Central America (Nava-Lara and Manea, 2022). Visualization was performed with open-source software Paraview (www.paraview.org).
ACKNOWLEDGMENTS
Numerical simulations presented in this review paper were generated using the Horus-HPCC at the Centro de Geociencias UNAM, and additional computational recourses from the National Laboratory for Advanced Scientific Visualization (LAVIS) at Universidad Nacional Autónoma de México (UNAM) (www.lavis.unam.mx) computing facility. This work received support from LAVIS software engineers Luis Alberto Aguilar Bautista, Alejandro de León Cuevas, and Alejandro Avalos. This work was partly supported by FY2021 Invitational Fellowships for Research in Japan (Long-term) and the UNAM-DGAPA-PAPIIT project grant IN114524. Figures were created using ParaView open-source software (version: ParaView 5.4.1, URL link: https://www.paraview.org/download/).
REFERENCES
Bandy, W., Taran, Y., Mortera, C., Kostoglodov, V., 2011, Geodynamics of the Mexican Pacific Margin: 10.1007/978-3-0348-0197-3.
Blue Brain Project, 2016, Tide: Tiled Interactive Display Environment: available at https://github.com/BlueBrain/Tide, query date 01/06/2023.
Bioli, F., Carrez, P., Cordier, P., 2017, Pure climb creep mechanism drives flow in Earth’s lower mantle: Science Advances, 3(3), DOI: 10.1126/sciadv.1601958.
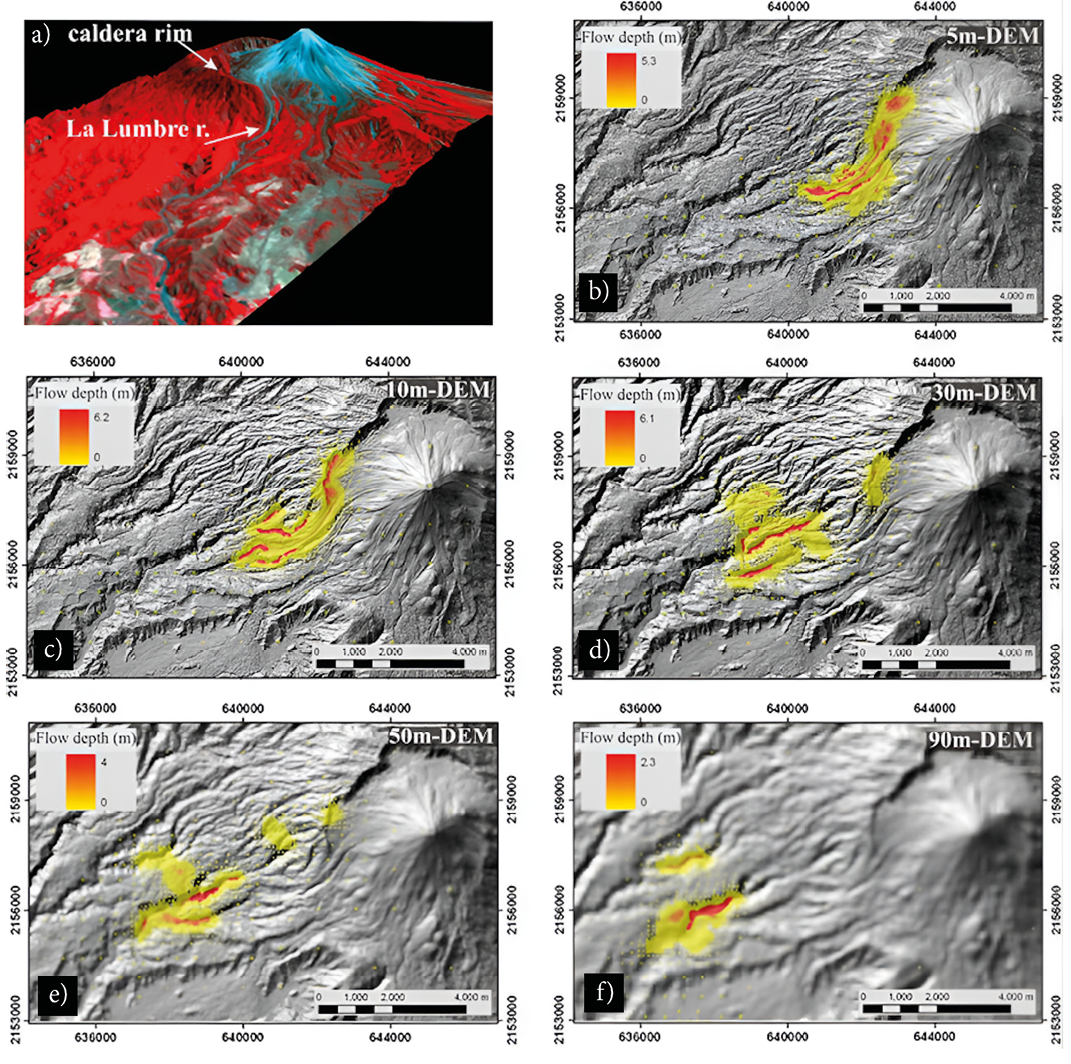
Capra, L., Manea, V.C., Manea, M., Norini, G., 2011, The importance of digital elevation model resolution on granular flow simulations: a test case for Colima volcano using TITAN2D computational routine: Natural Hazards 59, 665-680, https://doi.org/10.1007/s11069-011-9788-6.
Carter, N.L., Horseman, S.T., Russell, J.E., Handin, J., 1993, Rheology of rocksalt: Journal of Structural Geology, 15(9-10), 1257-1271, ISSN 0191-8141.
Clarke, L., Glendinning, I., Hempel, R., 1994, The MPI Message Passing Interface Standard: The International Journal of Supercomputer Applications, 8, doi:10.1007/978-3-0348-8534-8_21.
Clayton, R.W., Davis, P.M., Perez-Campos, X., 2007, Seismic structure of the subducted Cocos plate: Eos Transactions AGU, Joint Assembly Supplement 88(23), Abstract T32A-01.
Crockett, T.W., 1997, An introduction to parallel rendering: Parallel Computing, 23, 819-843.
Correa, W.T., Klosowski, J.T., Silva, C.T., 2002, Out- of-core sort-first parallel rendering for cluster-based tiled displays, in Bartz, D., Pueyo, X. Reinhard, E. (eds.), Proceedings of the Fourth Eurographics Workshop on Parallel Graphics and Visualization, The Eurographics Association, 89-96.
Espíndola, J. M., Macías, J. L., Tilling, R.I., Sheridan, M.F., 2000, Volcanic history of El Chichón Volcano (Chiapas, Mexico) during the Holocene, and its impact on human activity: Bulletin of Volcanology, 62, 90-104, https://doi.org/10.1007/s004459900064.
Ferrari, L., 2004, Slab detachment control on mafic volcanic pulse and mantle heterogeneity in Central Mexico: Geology, 32, 77-80, 10.1130/G19887.1.
Ferrari, L, Orozco-Esquivel, T., Manea, V.C., Manea, M., 2012, The dynamic history of the Trans-Mexican Volcanic Belt and the Mexico subduction zone, Tectonophysics, 522-523, 122-149, ISSN 0040-1951, https://doi.org/10.1016/j.tecto.2011.09.018.
Gerya, T., 2009, Introduction to Numerical Geodynamic Modelling (1st ed): Cambridge, Cambridge University Press, 358 pp, doi:10.1017/CBO9780511809101.
Gerya, T., 2019, Introduction to Numerical Geodynamic Modelling (2nd ed.): Cambridge, Cambridge University Press, 484pp, doi:10.1017/9781316534243.
Gerya, T.V., Yuen, D.A., 2007, Robust characteristics method for modeling multiphase visco-elasto-plastic thermo-mechanical problems: Physics of the Earth and Planetary Interiors, 163, 83-105.
Gomez-Tuena, A., LaGatta, A., Langmuir, C., Goldstein, S., Ortega-Gutierrez, F., Carrasco-Nunez, G., 2003, Temporal control of subduction magmatism in the eastern Trans-Mexican volcanic belt: Mantle sources, slab contributions and crustal contamination: Geochemistry, Geophysics and Geosystems, 4(8), 8912, DOI 10.1029/2003GC000524.
Gurnis, M., Hall, C., Lavier, L., 2004, Evolving force balance during incipient subduction: Geochemistry Geophysics Geosystems, 5, Q07001.
Hirth, G., Kohlstedt, D.L., 1996, Water in the oceanic upper mantle: implications for rheology, melt extraction and the evolution of the lithosphere: Earth and Planetary Science Letters, 144, 93-108.
Hirth, G., Kohlstedt, D.L., 2003, Rheology of the upper mantle and the mantle wedge: A view from the experimentalists: Washington DC, American Geophysical Union Geophysical Monograph Series, 138, 83-105, doi:10.1029/138GM06.
Humphreys, G., Hanrahan, P., 1999, A distributed graphics system for large tiled displays: IEEE Visualization, 215-224.
Jackson, M., Hudec, M., 2017, Salt Flow, in Salt Tectonics: Principles and Practice: Cambridge, England, Cambridge University Press, 28-60.
Jödicke, H., Jording, A., Ferrari, L., Arzate, J., Mezger, K., Rüpke, L., 2006, Fluid release from the subducted Cocos plate and partial melting of the crust deduced from magnetotelluric studies in southern Mexico: Implications for the generation of volcanism and subduction dynamics: Journal of Geophysical Research, 111, B08102.
Karato, S.-I., 2013, Physics and Chemistry of the Deep Earth: Chichester, West Sussex, UK, John Wiley & Sons, Ltd, 416 pp.
Kohlstedt, D., 2007, Properties of Rocks and Minerals – Constitutive Equations, Rheological Behavior, and Viscosity of Rocks, 389-417, doi:10.1016/B978-044452748-6/00043-2.
Li, Z., Miyafuji, S., Wu, E., Kuzuoka, H., Yamashita, N., Koike, H., 2019, OmniGlobe: An Interactive I/O System For Symmetric 360-Degree Video Communication, in Proceedings of the 2019 Designing Interactive Systems Conference (DIS '19): San Diego California, USA, ACM Digital Library, 1427-1438, https://doi.org/10.1145/3322276.3322314.
Manea, M., Manea. V.C., 2011, Flat-slab thermal structure and evolution beneath central Mexico: Pure and Applied Geophysics, 168, 1475-1487.
Manea, V.C., Manea, M., Kostoglodov, V., Sewell, G., 2005, Thermal models, magma transport, and velocity estimation beneath southern Kamchatka. in Foulger, G.R., Natland, J.H., Presnell, D.C., Anderson, D.L. (eds.), Plates, Plumes and Paradigms: GSA Special Paper, 388-31, 517-536, doi: 10.1130/0-8137-2388-4.517.
Manea, V.C., Pérez-Gussinyé, M., Manea, M., 2012, Chilean flat slab subduction controlled by overriding plate thickness and trench rollback: Geology, 40(1), 35-38.
Manea, V., Leeman, W., Gerya, T. Manea, M., 2014, Subduction of fracture zones controls mantle melting and geochemical signature above slabs: Nature Communications, 5, 5095, doi:10.1038/ncomms6095.
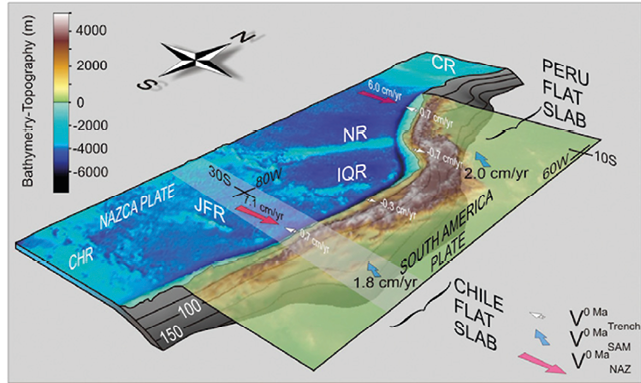
Manea, V.C., Manea, M., Ferrari, L., Orozco-Equivel, T., Valenzuela, R., Husker, A., Kostoglodov, V., 2017, A review of the geodynamic evolution of flat slab subduction in Mexico, Peru, and Chile: Tectonophysics, 695, 27-52, doi:10.1016/j.tecto.2016.11.037.
Manjrekar, S., Sandilya, S., Bhosale, D., Kanchi, S., Pitkar, A., Gondhalekar, M., 2014, "CAVE: An Emerging Immersive Technology -- A Review", in UKSim-AMSS 16th International Conference on Computer Modelling and Simulation: Cambridge, UK, IEEE Xplore, 131-136.
McNamara, A.K., Zhong, S., 2004, Thermochemical structures within a spherical mantle: Superplumes or piles?: Journal of Geophysical Research: Solid Earth, 109 (B7), B07402.
Molnar, S., Cox, M., Ellsworth, D., Fuchs, H., 1994, A sorting classification of parallel rendering: IEEE Computer Graphics and Applications, 14(4), 23-32.
Moreno, J.S., Manea, M., 2021. Geodynamic evaluation of the pacific tectonic model for Chortis block evolution using 3D numerical models of subduction, Journal of South American Earth Sciences, 112, Part 2, 103604, ISSN 0895-9811, doi: 10.1016/j.jsames.2021.103604.
Moresi, L., Zhong, S., Han, L., Conrad, C., Tan, E., Gurnis, M., Choi, E., Thoutireddy, P., Manea, V.C., McNamara, A., Becker, T., Leng, W., Armendariz, L., 2014, CitcomS v3.3.1: Zenodo, available at <https://zenodo.org/records/7271920>, software, doi:10.5281/zenodo.7271920.
Nava-Lara, S.V., Manea, V.C., 2022, Numerical models for slab tearing beneath southern Mexico and northern Central America: Journal of South American Earth Sciences, 115, 103771, ISSN 0895-9811, doi: 10.1016/j.jsames.2022.103771.
Oeser, J., Bunge, H.P., Mohr, M., 2006, Cluster Design in Gerndt, M., Kranzlmuller, D. (eds), the Earth Sciences-Tethys: Berlin Heidelberg, Germany, Springer-Verlag, HPCC, LNCS 4208, 31-40.
Pardo, M., Suárez, G, 1995, Shape of the Subducted Rivera and Cocos Plates in Southern Mexico: Seismic and Tectonic Implications: Journal of Geophysical Research, 100, 12357-12373.
Patra, A., Bauer, A., Nichita, C.C., Pitman, E.B., Sheridan, M.F., Bursik, M.I., Rupp, B., Webber, A., Stinton, A.J., Namikawa, L., Renschler, C., 2005, Parallel adaptive numerical simulation of dry avalanches over natural terrain: Journal of Volcanology and Geothermal Research, 139, 1-21.
Payero, J., Kostoglodov, V., Shapiro, N., Mikumo, T., Iglesias, A., Perez-Campos, X., Clayton, R., 2008, Non-volcanic tremor observed in the Mexican subduction zone: Geophysical Research Letters, 35, L07305.
Pérez-Campos, X., Kim, Y.H., Husker, A. Davis, P., Clayton, R., Iglesias, A., Pacheco, J., Singh, S., Manea, V.C., Gurnis, M., 2008, Horizontal subduction and truncation of the Cocos Plate beneath Central Mexico: Geophysical Research Letters, 35, 10.1029/2008GL035127.
Pitman, E.B., Nichita, C.C., Patra, A., Bauer, A., Sheridan, M.F., Bursik, M.I., 2003, Computing granular avalanches and landslides: Physics of Fluids 15(12), 3638-3646.
Strak, V., Schellart, W.P., 2021, Thermo-mechanical numerical modeling of the South American subduction zone: A multi-parametric investigation: Journal of Geophysical Research: Solid Earth, 126, e2020JB021527, doi:10.1029/2020JB021527.
Syracuse, E.M., Abers, G.A., 2006, Global compilation of variations in slab depth beneath arc volcanoes and implications: Geochemistry Geophysics Geosystems, 7, Q05017.
Tan, E. Choi, E., Thoutireddy, P., Gurnis, M., Aivazis, M., 2006, GeoFramework: coupling multiple models of mantle convection within a computational framework: Geochemistry, Geophysics, Geosystems, 7, Q06001, 14 pp.
Turcotte, D.L., Schubert, G., 2002, Geodynamics (2nd ed): Cambridge, UK, Cambridge University Press, 456 pp.
Zhong, S., Zuber, M.T., Moresi, L., Gurnis, M., 2000, Role of temperature-dependent viscosity and surface plates in spherical shell models of mantle convection: Journal of Geophysical Research: Solid Earth, 105(B5), 11063-11082.