How to cite: Rodríguez-Pérez, C., 2023, Ground motion simulations of the 1887 Pinal de Amoles (MW = 5.53) and the 1989 Landa de Matamoros (MW = 4.94) earthquakes, Querétaro, Mexico: Revista Mexicana de Ciencias Geológicas, v. 40, núm. 3, p. 294-307, DOI: 10.22201/cgeo.20072902e2023.3.1753.


REVISTA MEXICANA DE CIENCIAS GEOLÓGICAS

v. 40, núm. 3, 2023, p. 294-307

DOI: http://dx.doi.org/10.22201/cgeo.20072902e2023.3.1753


Ground motion simulations of the 1887 Pinal de Amoles (MW = 5.53) and the 1989 Landa de Matamoros (MW = 4.94) earthquakes, Querétaro, Mexico


Quetzalcoatl Rodríguez-Pérez


Centro de Geociencias, Universidad Nacional Autónoma de México, Campus Juriquilla,Blvd. Juriquilla 3001, Querétaro 76230, Mexico.

* quetza@geociencias.unam.mx


ABSTRACT

Ground motions characteristics of the 1887 Pinal de Amoles (MW = 5.53) and the 1989 Landa de Matamoros (MW = 4.94) Querétaro earthquakes were studied. For this purpose, the specific barrier model (SBM) was implemented in the context of the stochastic ground motion representation of earthquakes. The SBM was calibrated by modeling the peak ground acceleration (PGA) and the Fourier acceleration spectra (FAS) of the 11 May 2016 (MW = 4.80) Guadalajara earthquake. The calibration results showed that the SBM and selected source and path parameters were able to reproduce synthetic PGA and spectra in good agreement with observed waveforms; in particular, a stress drop of 160 bars fits the results better. Several rupture scenarios for the 1887 and 1989 events were performed by obtaining synthetic seismograms considering different values of stress drop (10, 30, 50, 100, 150, 200, 300, and 500 bars). For a typical stress-drop value of 100 bars, the PGA at distances of 10 and 200 km are in the following intervals: 2.57–295 cm/s2 and 1.72–186 cm/s2 for the Pinal de Amoles and Landa de Matamoros earthquakes, respectively. The results obtained in this study contribute toward a better understanding of strong ground motions in the region.

Keywords: Ground motion simulation; peak ground acceleration; specific barrier model; Mexico.


RESUMEN

Se estudiaron las características de los movimientos de terreno de los sismos de Pinal de Amoles de 1887 (MW = 5.53) y Landa de Matamoros de 1989 (MW = 4.94) en Querétaro. Para este propósito, se implementó el modelo de barrera específica (SBM) en el contexto de la representación estocástica del movimiento del suelo de los terremotos. El SBM se calibró modelando la aceleración máxima del suelo (PGA) y los espectros de aceleración de Fourier (FAS) del terremoto de Guadalajara del 11 de mayo de 2016 (MW = 4.80). Los resultados de la calibración mostraron que el SBM y los parámetros fuente y trayectoria seleccionados fueron capaces de reproducir los espectros y PGA sintéticos en concordancia con las formas de onda observadas; en particular, una caída de esfuerzos de 160 bares, ajusta mejor los resultados. Se realizaron varios escenarios de ruptura para los eventos de 1887 y 1989 mediante la obtención de sismogramas sintéticos considerando diferentes valores de caída de esfuerzos (10, 30, 50, 100, 150, 200, 300 y 500 bares). Para un valor típico de caída de esfuerzos de 100 bars, los PGA a distancias de 10 y 200 km están en los siguientes intervalos: 2.57–295 cm/s2 y 1.72–186 cm/s2 para los sismos de Pinal de Amoles y Landa de Matamoros, respectivamente. Los resultados obtenidos en este estudio contribuyen a una mejor comprensión de los movimientos fuertes del terreno en la región.

Palabras clave: simulación de movimientos fuertes; aceleración máxima del suelo; modelo de barrera específico; México.


Manuscript received: May 13, 2023

Corrected manuscript received: July 19, 2023

Manuscript accepted: July 22, 2023


INTRODUCTION

The State of Querétaro is located in the central segment of the Trans-Mexican Volcanic Belt (TMVB). The TMVB is a Neogene volcanic arc with a length of about 1000 km between 18.5°N and 21°W (Ferrari et al., 2012). The seismicity of the TMVB is not directly associated with the subduction zone but is due to multiple East-West striking normal faults (Suter, 1991; Suter et al., 1992, 1995a and 1995b). In particular, the State of Querétaro is classified as a region with a low seismicity rate. However, some intermediate earthquakes (M ~ 5.0) have taken place, such as the 1887 Pinal de Amoles earthquake (mb = 5.3) and the 1989 Landa de Matamoros earthquake, mb = 4.6 (Suter et al., 1996). The earthquakes in the State of Querétaro mainly originate in the crust at a shallow depth, which is why they can cause significant damage to the population and the infrastructure located in the epicentral zones. The seismicity reported in the state of Querétaro is characterized by earthquakes with magnitudes in the range of 0.7–5.3 (Suter et al., 1996; Zúñiga et al., 2003; Clemente-Chavez et al., 2013; León-Loya, 2014; Rodríguez-Pérez, 2022).

Calculating ground motions at a given site from a postulated earthquake of known magnitude is a fundamental problem for seismologists and earthquake engineers. Empirical relationships and physical models can be used to evaluate ground motion features. In the first approach, several ground-motion observations, such as peak values of displacement, velocity, and accelerations from different earthquakes with different characteristics, are used to construct a predictive equation (model). Although the empirical approach gives accurate predictions for regions with abundant data, it does not give us insights into the physical aspects of the earthquake rupture. In the second approach, ground motions are obtained by modeling earthquakes to describe the physics of seismic faulting based on limited observations. Here, the limited observations are used only to calibrate the physical model. Ground motion models are mainly developed in the context of the stochastic modeling approach (Boore, 2003) and random vibration theory. The seismic source, wave propagation parameters, and site effects must be known to evaluate reliable seismic hazards for a region using the physical method. Generally, Brune’s model is used to describe the seismic source, and Brune’s model represents the seismic radiation from a point source (Brune, 1970). However, a more precise source model is the specific barrier model (SBM) proposed by Papageorgiou and Aki (1983a, 1983b). Unlike Brune’s model, the SBM can be used to model heterogeneous rupture (Papageorgiou, 1988). Another advantage of the SBM is that the model can be used for both ‘near-source’ and ‘far-field’ strong ground motion simulations (Mavroeidis and Papageorgiou 2003; Mavroeidis et al., 2004). The SBM method is versatile because few parameters are required in the implementation. Incorporating this source model with suitable path and site effect models makes it possible to have a complete description of the ground-motion observations. In this article, the SBM is used to simulate the ground motions of the 1887 Pinal de Amoles and the 1989 Landa de Matamoros earthquakes. The results can help evaluate the seismic risk in the State of Querétaro.


TECTONIC SETTING

Here, some geological characteristics of the epicentral zones of the 1887 Pinal de Amoles and 1989 Landa de Matamoros earthquakes in the state of Querétaro are briefly described (Figure 1). Pinal de Amoles is located at the boundary of two geological provinces, the north-south striking late Cenozoic normal faults of northern Mexico and the region of east-west striking late Miocene to Quaternary normal faults typical for the TMVB. The former geological province is part of the Basin and Range province (Suter, 1987; Henry and Aranda-Gómez, 1992). In the epicentral region of the 1887 event, a north-south trending lineament 45 km long is observed, which is probably the expression of a late Cenozoic normal fault (Suter et al., 1996). According to Suter et al. (1996), the presence of this lineament and the north-south elongation of the inner-most calculated intensity contours support the hypothesis that the 1887 event took place on a north-south striking Basin and Range normal fault. On the other hand, the epicentral zone of the Landa de Matamoros earthquake is located within the Sierra Madre Oriental fold-thrust belt where the outcropping rocks are mostly limestones and shales in folds striking north-northwest-south-southeast (Carrillo-Martínez, 1989, 1990). The distance between the two epicenters is about 30 km, but it is unclear if the two events are related to the same fault system (Suter et al., 1996).


Figure 1. Earthquake locations of studied events. a) Epicenter location of the 1887 Pinal de Amoles and 1989 Landa de Matamoros earthquakes in Querétaro (color stars); b) Location of the 2016 Guadalajara earthquake (red star) and strong ground motion stations: GDLP, GDLC and CDGU (black triangles).


DATA AND METHODS

In this article, the SBM in the context of the stochastic method to simulate ground motions is implemented. First, the method was calibrated using an instrumentally recorded earthquake with similar characteristics to the target earthquakes, the 1887 and 1989 events. For the case of the 1989 earthquake, no seismic records were obtained, so the 11 May 2016 (MW = 4.8) Guadalajara earthquake was used to test and calibrate the SBM. This earthquake was selected because it is comparable in magnitude with the Landa de Matamoros event, tectonic environment (all events took place in the TMVB), and hypocentral depth. Once the SBM was implemented and calibrated, synthetic acceleration records and peak ground acceleration (PGA) curves were generated.


Data

Acceleration records of the Accelerographic Network of the Instituto de Ingeniería of the Universidad Nacional Autónoma de México (RAII-UNAM) were used. For the case of the 11 May 2016 (MW = 4.8) Guadalajara earthquake, three records were obtained, one at the rock site (station CDGU) and two at the soil sites (stations GDLC and GDLP). The station at the rock site is equipped with an ETNA Episensor accelerometer, sampled at 200 Hz (Kinemetrics, USA). On the other hand, the stations located at soil sites are instrumented with K2 accelerometers with a sampling frequency of 100 Hz (Kinemetrics, USA). The hypocentral distances of the three seismic stations are 21.77, 24.78, and 124 km (stations GDLP, GDLC, and CDGU, respectively). Figure 1 shows seismic stations and epicentral locations of all the earthquakes studied.


The Specific Barrier Model

The well-established stochastic modeling approach and random vibration theory to predict ground motions (Boore, 2003) were applied to determine ground motion features of analyzed earthquakes. In the frequency domain, the Fourier amplitude spectrum of displacement, Y(M0, r, f), for horizontal ground motions due to S-waves may be calculated as a product of the source spectrum E(M0, f), propagation path effects P(r, f), site effects G(f), and the type of motion considered, I(f) as:

Y(M0, r, f ) = E(M0, f )P(r, f )G(f )I(f ) (1)

where M0 is the seismic moment, f is the frequency, and r is the hypocentral distance. The instrumental control term I(f ) can be expressed as follows: I(f ) = (2πf )n, and n is equal to 0, 1, or 2 when related to displacement, velocity, and acceleration, respectively. The SBM was introduced by Papageorgiou and Aki (1983a, 1983b) for the quantitative description of heterogeneous seismic rupture (Papageorgiou, 1988). In the SBM, the earthquake rupture can be represented as an aggregate of circular subevents of equal diameter, 2ρ0 (or barrier interval), filling up a rectangular fault plane of length (L) and width (W), as shown schematically in Figure 2. As seismic rupture propagates, a stress drop (ΔσL) (or local stress drop) takes place in each subevent, starting from its center and spreading radially with a constant rupture velocity (VR). The source term can be expressed as:

E(M0, f ) = cS(M0, f )D(f, fmax) (2)

where D(f, fmax) is a low-pass filter with a cutoff frequency (fmax), c is a frequency-independent factor equal to FRθφV/(4πρβ3), where F is the free surface amplification (a factor equal to 2), Rθφ is the averaged radiation pattern (0.55 for S-waves), V is the partition onto two horizontal components (1/2), ρ is the rock density, and β is the S-waves velocity. The source spectrum S(M0, f ) represents the average S-wave radiation of seismic waves from the source, which in this article is modeled by the specific barrier model.

The acceleration source spectrum using the specific barrier model may thus be expressed as (Papageorgiou, 1988; Halldorsson and Papageorgiou, 2005):

(3)

where N is the total number of subevents, T is the faulting duration for the whole rupture, and M0i(f) is the far-field displacement spectrum of the individual subevent or subevent spectrum (Papageorgiou, 1988). The number of subevents fulfills the condition that the aggregate subevent moment is equal to the total seismic moment. The spatial distribution of cracks on the main fault is confined by the geometry of the fault plane, as indicated in Figure 2. The size of the subfault may be obtained from the following empirical relationship (Halldorsson and Papageorgiou, 2005): log 2ρ0 = -2.58 + 0.5MW.

The parameter ζ accounts for the observed deviation from self-similar scaling (with magnitude) of the high-frequency source spectral levels of earthquakes in interplate and extensional tectonic regimes as ζ = 102η with η = -0.12(MW – 6.3) (Halldorsson and Papageorgiou, 2005). The shear wave source displacement spectrum of a single subevent is approximated by the ω-square spectrum, written as:

(4)

where M0i = (16/7)ΔσLρ03 and f2 is related to the crack radius (ρ0) by the following expression: f2 = Csβ/2πρ0, where the parameter Cs depends on the ratio VR/β (1.72 ≤ Cs ≤ 1.85 for 0.7 ≤ VR/β ≤ 0.9) (Sato and Hirasawa, 1973; Aki and Richards, 1980).

The function D(f, fmax) in equation 2 accounts for the decay of acceleration spectral levels above fmax (Hanks, 1979; Papageorgiou and Aki, 1983a, 1983b; Papageorgiou, 1988). The fmax filter is defined as

D(f, fmax) = [1+(f/fmax)2s]-1/2, where s controls the decay rate above fmax and is usually taken as s = 4 (Boore, 1983). Alternatively, Anderson and Hough (1984) showed that the onset of high-frequency spectral decay could be characterized by an observational parameter κ (or κ filter). The κ filter is defined as: D(f, κ) = A(f ) exp(-πκf ), A( f ) accounts for site amplification derived from several techniques such as the H/V ratio or theoretical generic rock site amplification functions (Boore and Joyner, 1997). Here, both filters in an application were combined, as Boore (2003) suggested. The path attenuation function P(r, f ) includes both regional anelastic and scattering attenuation (DQ(r, f ) = exp(-πrf/Q( f )β) where the quality factor is Q( f ) = Q0f n), and geometric spreading effects expressed as: D(r) = r-k. The next step of the ground motion simulation is constructing a random-phase signal in the time domain and multiplying it by a seismic wave-like shaping window. The shaping window applied to the noise can be either a simple box window or a window that gives a more realistic shape for the acceleration time series, such as the Saragoni-Hart function (Saragoni and Hart, 1974).


Figure 2. Schematic representation of the SBM. The fault plane is made up of the aggregate of circular cracks with a diameter 2ρ0 on a fault plane (A = LW).

A local stress drop (ΔσL) occurs in each crack as it ruptures. The rupture begins at the center of each crack. It spreads radially outward (the light circles denote the rupture fronts at successive time instants) until the barriers stop it, denoted by the shaded area between the cracks (modified from Halldorsson and Papageorgiou, 2005).


Ground motion calibration

The SBM method was tested and calibrated by simulating ground motions from the 11 May 2016 (MW = 4.8) Guadalajara earthquake. Singh et al. (2017) studied source and ground motion characteristics from this event. To model this event, the results of Singh et al. (2017) were considered as input parameters for the SBM: ρ = 2850 kg/m3,

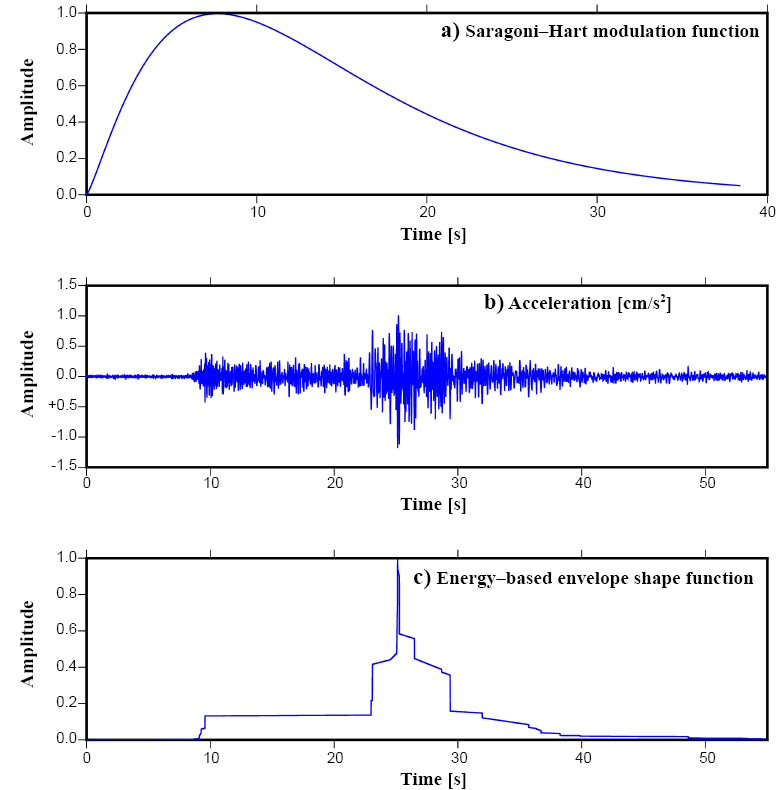
β = 3.8 km/s, L = 3.5 km, W = 3.5 km, VR = 3.7 km/s, κ = 0.01 s, and Q( f ) = 141f0.63. D(r)= 1/r for r ≤ 70 km and 1/(70r)0.5 for r > 70 km. Site amplifications were taken from generic rock and soil functions estimated by Boore and Joyner (1997), shown in Table 1. The amplifications are based on shear velocity and density as functions of depth obtained from borehole data and crustal velocity studies. The amplifications are computed using the quarter-wavelength approximation (Joyner et al., 1981). For a particular frequency, the amplification is given by the square root of the ratio between the seismic impedance averaged over a depth and the seismic impedance at the depth of the source. A simplified representation of the path duration TP in seconds was adopted as TP = 0.16(r – 10) for r < 70 km and Tp = 9.6 – 0.03(r – 70) for 70 ≤ r < 130 km, where r is the hypocentral distance in km (Atkinson and Boore, 1995). The simulations used two envelope functions: 1) Saragoni-Hart type function and 2) empirical envelope shape functions that are directly defined based on the energy distribution profile of given earthquake records based on Li et al. (2017), as shown in Figure 3.

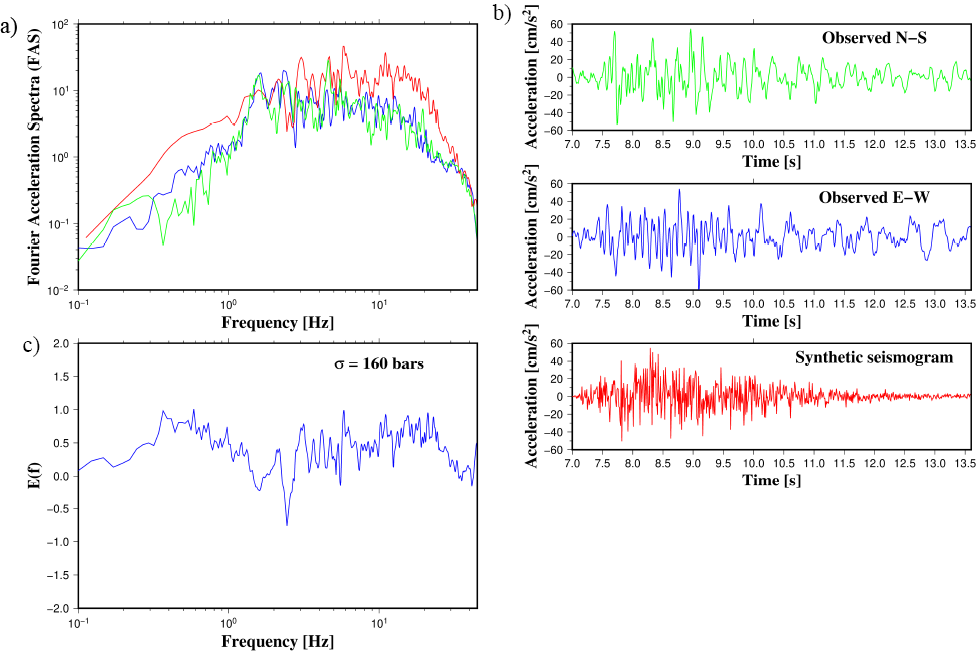
To generate synthetic accelerograms, ΔσL was varied (from 30 to 300 bars), looking for the best stress drop value to fit better the synthetic and observed records (Figures 4 to 9). The best fit was obtained with a stress drop of 160 bars, and this value is similar to the value of 100 bars reported by Singh et al. (2017). A spectral error function introduced by Castro et al. (2008) was also used to calculate differences between observed and synthetic acceleration spectra (Figures 4 to 9). The error function is defined as:
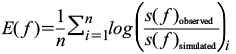
, (5)

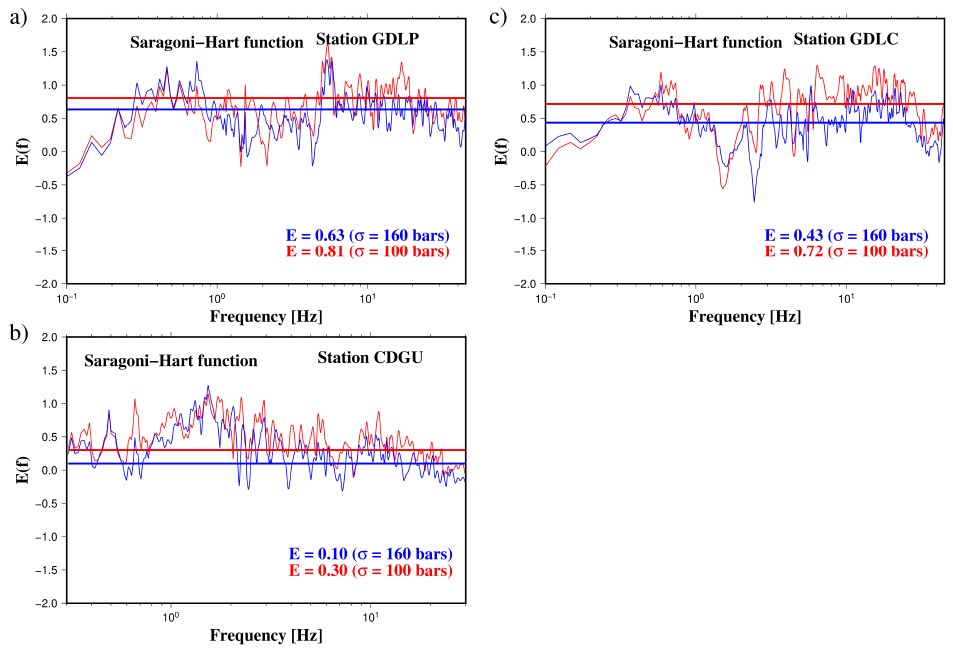
where n is the number of stations/components modeled, and S( f ) is the acceleration spectra. Figures 10 and 11 show the comparison of error functions for results considering stress-drop values of 160 and 100 bars using the Saragoni-Hart and energy-based envelope functions. The spectral match is consistent with the observations of the 2016 Guadalajara earthquake. In terms of the peak accelerations, both envelope functions can simulate comparable PGA values, as shown in Figure 12. The logarithmic ratio between observed and calculated maximum accelerations is lower than 0.3. The Saragoni-Hart envelope function is able to characterize ground motions of the most energetic part of the seismogram after the S-waves (Figures 7 to 9). On the other hand, the energy-based envelope function generates more realistic synthetic seismograms, including motions before the S-waves (Figures 4 to 6). The simulation results indicate that the SBM can be used to model historical earthquakes lacking instrumental records.


Table 1. Generic rock-site amplification functions (Boore and Joyner, 1997).

Frequency (Hz)

Rock Site Amplification

Soil Site Amplification

0.01

1.00

1.00

0.09

1.10

1.34

0.16

1.18

1.57

0.51

1.42

2.24

0.84

1.58

2.57

1.25

1.74

2.76

2.26

2.06

2.98

3.17

2.25

2.95

6.05

2.58

3.05

16.60

3.13

3.18

61.20

4.00

3.21


Figure 3. Examples of modulation functions used in the ground motion simulations. a) Saragoni-Hart modulation function starting with the arrival time of S-waves. b) Horizontal component for the 11 May 2016 (MW = 4.80) Guadalajara earthquake. c) Energy-based envelope shape for the Guadalajara event used to generate more realistic synthetic seismograms.


Figure 4. Ground motion results for the 11 May 2016 (MW = 4.80) Guadalajara earthquake at station GDLP (Soil site, R = 21.77 km). a) Seismograms for the E-W component (blue color) and synthetic one (red color); b) Seismograms for the N-S component (blue color) and synthetic one (red color); c) Spectra for the E-W component (blue color) and synthetic one (red color); d) Spectra for the N-S component (blue color) and synthetic one (red color); e) Error function for the E-W component to compare observed and synthetic spectra; f) Error function for the N-S component to compare observed and synthetic spectra.


Figure 5. Ground motion results for the 11 May 2016 (MW = 4.80) Guadalajara earthquake at station GDLC (Soil site, R = 24.78 km). a) Seismograms for the E-W component (blue color) and synthetic one (red color); b) Seismograms for the N-S component (blue color) and synthetic one (red color); c) Spectra for the E-W component (blue color) and synthetic one (red color); d) Spectra for the N-S component (blue color) and synthetic one (red color); e) Error function for the E-W component to compare observed and synthetic spectra; f) Error function for the N-S component to compare observed and synthetic spectra.


RESULTS AND DISCUSSION

In this study, the specific barrier model implemented in the stochastic method has been used and calibrated to study two crustal earthquakes in the TMVB. When seismic ground motion records are not available, the representation of expected accelerations at particular sites from earthquakes of particular magnitudes and building codes for seismic design may mandate the generation of synthetic earthquake time histories as input in the dynamic study of structures. The availability of seismic records from historical earthquakes useable for this purpose depends on the tectonic environment, the seismicity rate, and the history of instrumental monitoring. In the case of low-seismicity zones such as Querétaro State with large recurrence intervals, the use of seismological physics-based models becomes imperative to represent the ground motion generation and propagation. Among them, the stochastic method and its derivations, such as the SBM, have been widely applied to study historical and instrumented earthquakes because of their ability to simulate the higher-frequency ground motions of most interest to civil engineers.

To model the 1887 Pinal de Amoles and the 1989 Landa de Matamoros earthquakes, the body-wave magnitude (mb) reported by Suter et al. (1996) was first transformed to MW using relationships derived by Scordilis (2006), obtaining 5.53 and 4.94 for the 1887 and 1989 earthquakes, respectively. In the simulations, the following parameters were used: ρ = 2800 kg/m3, β = 3.8 km/s, VR = 3.7 km/s, κ = 0.01 s, and fmax = 18 Hz. Fault dimensions for the Pinal de Amoles event are L = 7.8 km and W = 6.5 km. In the case of the Landa de Matamoros earthquake, fault dimensions are L = 4.0 km and W = 3.8 km. It was also assumed that the observation points were located on rock sites. Site effects were quantified by a generic rock site amplification function of Boore and Joyner (1997). The frequency-dependent quality factor for the central segment of the TMVB was used (Q(f) = 107f0.98, Pérez-Moreno et al., 2021). The segmented path duration relationship of Atkinson and Boore (1995) was also used. The geometrical spreading term was taken as 1/r for r ≤ 100 km and 1/(100r)0.5 for r > 100 km. Different rupture scenarios were performed by varying the stress drop within the interval of 10 bars < ΔσL < 500 bars, recorded at hypocentral distances from 10 to 200 km (Figure 13). The results showed that at a distance of 10 km from the seismic source, the expected PGA is in the range of 26.19 – 1350 cm/s2 and 19.26 - 919 cm/s2 for the 1887 and 1989 events, respectively. At the same distance, the representative stress-drop value of 100 bars exhibits peak accelerations of 295 cm/s2 and 186 cm/s2 for the Pinal de Amoles and Landa de Matamoros earthquakes, respectively. On the contrary, at a distance of 200 km, maximum accelerations fluctuate from 0.21 to 12.42 cm/s2 and from 0.12 to 7.58 cm/s2 for the 1887 and 1989 earthquakes, respectively.


Figure 6. Ground motion results for the 11 May 2016 (MW = 4.80) Guadalajara earthquake at station CDGU (Rock site, R = 124 km). a) Seismograms for the E-W component (blue color) and synthetic one (red color); b) Seismograms for the N-S component (blue color) and synthetic one (red color); c) Spectra for the E-W component (blue color) and synthetic one (red color); d) Spectra for the N-S component (blue color) and synthetic one (red color); e) Error function for the E-W component to compare observed and synthetic spectra; f) Error function for the N-S component to compare observed and synthetic spectra.


Figure 7. Ground motion results for the 11 May 2016 (MW = 4.80) Guadalajara earthquake. a) Spectra for horizontal components (blue and green colors) and synthetic ones (red color); b) Seismograms for horizontal components (blue and green colors) and synthetic ones using a Saragoni-Hart function (red color); c) Error function to compare observed and synthetic spectra recorded at station GDLP (Soil site, R = 21.77 km).


Figure 8. Ground motion results for the 11 May 2016 (MW = 4.80) Guadalajara earthquake. a) Spectra for horizontal components (blue and green colors) and synthetic ones (red color); b) Seismograms for horizontal components (blue and green colors) and synthetic ones using a Saragoni-Hart function (red color); c) Error function to compare observed and synthetic spectra recorded at station GDLC (Soil site, R = 24.78 km).


Figure 9. Ground motion results for the 11 May 2016 (MW = 4.80) Guadalajara earthquake. a) Spectra for horizontal components (blue and green colors) and synthetic ones (red color); b) Seismograms for horizontal components (blue and green colors) and synthetic ones using a Saragoni-Hart function (red color); c) Error function to compare observed and synthetic spectra recorded at station CDGU (Rock site, R = 124 km).


A comparison between simulated PGA values and PGA estimated from seismic intensity calculations was also carried out (Figure 14). Seismic intensities were converted to PGA with the relationships of Wald et al. (1999). Intensities for the 1887 Pinal de Amoles earthquake fluctuated from 4 to 8, while for the 1989 Landa de Matamoros event varied from 2.0 to 7.5 (Suter et al. 1996), see Figure 14. At short distances (R < 50 km), simulated scenarios for the Landa de Matamoros earthquake can explain the accelerations derived from seismic intensities (Figure 14). On the other hand, PGA based on seismic intensities exhibits differences with simulated accelerations at distances greater than 50 km for the Pinal de Amoles earthquake (Figure 14). These differences may be due to inaccurate estimations of site effects. Although ground motions can vary significantly over the distance, the discrepancies in PGA values can also be attributed to the conversion relationships between PGA and the seismic intensities used.

Stress drop is a relatively stable parameter over a wide magnitude range with typical values of 150–160, 114, and 180 bars for interplate, extensional, and intraplate earthquakes, respectively (Halldorsson and Papageorgiou, 2005). Here, a wide variety of scenarios is presented, including extreme cases such as stress drops greater than 300 bars for shallow crustal earthquakes to know the accelerations expected under these conditions. On the other hand, some other studies showed cases of earthquakes with low values of ΔσL, for example, 7 < ΔσL < 10 bars for events in California and Iran (Chen and Atkinson, 2002; Mousavi et al., 2007). Those cases are also included in the proposed scenarios (Figure 13). The presented results can be used as a starting point for future studies of ground motions in the State of Querétaro. For example, more information on site effects is required. Local site effects for rock and soil sites can be approximately computed by implementing the H/V technique (Nakamura, 1989), but it requires seismic instrumentation. Specific models for κ and Q(f) in the epicentral regions are also needed. This study highlights the importance of increasing the seismic instrumentation in the epicentral regions of the Pinal de Amoles and Landa de Matamoros region to conduct seismological studies that help understand earthquake physics and in the estimation of the seismic risk in Querétaro.


Figure 10. Error functions estimated with the energy-based envelope shape function for the best simulated stress drop value (160 bars, blue curves) and stress drop value reported by Singh et al. (2017), 100 bars (red curves) for the 11 May 2016 (MW = 4.80) Guadalajara earthquake. a) Results for station CDGU, E-W component; b) Results for station GDLC, E-W component; c) Results for station GDLP, E-W component; d) Results for station CDGU, N-S component; e) Results for station GDLC, N-S component; f) Results for station GDLP, N-S component.


Figure 11. Error functions estimated with the Saragoni-Hart modulation function for the best-simulated stress drop (160 bars, blue curves) and stress-drop value reported by Singh et al. (2017), 100 bars (red curves) for the 11 May 2016 (MW = 4.80) Guadalajara earthquake. a) Results for station GDLP; b) Results for station CDGU; c) Results for station GDLC.


Figure 12. Comparison between the observed and simulated PGA values for the 11 May 2016 Guadalajara (MW = 4.80) earthquake. a) Blue squares indicate acceleration results calculated with a Saragoni-Hart function in the stochastic simulations; b) Red diamonds show acceleration results calculated with an energy-based envelope function used in the ground motion calculations.


Figure 13. Ground motion simulation results at different distances (10 km < R < 200 km). a) Synthetic PGA considering different stress-drop scenarios (10 bars < Δσ < 500 bars) for the 1887 Pinal de Amoles earthquake; b) Synthetic PGA considering different stress-drop scenarios (10 bars < Δσ < 500 bars) for the 1989 Landa de Matamoros earthquake.


Figure 14. Ground motion simulation results. a) Comparison between simulated PGA curves for different stress-drop scenarios and PGA values derived from reported seismic intensities (gray squares) for the 1887 Pinal de Amoles earthquake; b) Reported seismic intensities at different distances based on Suter et al. (1996) for the 1887 Pinal de Amoles event; c) Comparison between simulated PGA curves for different stress-drop scenarios and PGA values derived from reported seismic intensities (gray squares) for the 1989 Landa de Matamoros earthquake; d) Reported seismic intensities at different distances based on Suter et al. (1996) for the 1989 Landa de Matamoros event.


CONCLUSIONS

The specific barrier model was adopted to simulate strong ground motions of two earthquakes in the State of Querétaro, the 1887 Pinal de Amoles (MW = 5.53) and the 1989 Landa de Matamoros (MW = 4.94) earthquakes, respectively. The method was first calibrated by studying the 11 May 2016 (MW = 4.8) Guadalajara earthquake. The results of the calibration process showed that there is a good agreement between the observed and predicted peak ground accelerations (PGA) but also in terms of the Fourier amplitude spectra obtained from the synthetic and recorded waveform data. Both envelope functions used in the SBM provided comparable and realistic results. This indicates that the considered parameters, such as stress drop and attenuation properties, are appropriate for strong ground motion modeling in this region. Several rupture scenarios were conducted by varying the stress drop using the following values: 10, 30, 50, 100, 150, 200, 300, and 500 bars. Maximum ground accelerations at different distances were calculated (10 < R < 200 km). At close distances (R = 10 km), PGA results exhibit variations in the range of 26.19–1350 cm/s2 and 19.26–919 cm/s2 for the 1887 and 1989 earthquakes, respectively. Conversely, at a distance of 200 km, PGA ranges from 0.21 to 12.42 cm/s2 and from 0.12 to 7.58 cm/s2 for the Pinal de Amoles and Landa de Matamoros events. Therefore, it can be concluded that the proposed work and results obtained in this study contribute toward a better understanding of strong ground motions in the Querétaro region.


ACKNOWLEDGMENTS

Quetzalcoatl Rodríguez-Pérez was supported by the Mexican Consejo Nacional de Humanidades, Ciencia y Tecnología (CONAHCYT), through the Cátedras program- proyect 1126. Constructive reviews by Professor Raúl Castro and two anonymous reviewers helped to improve the manuscript.


REFERENCES

Anderson, J.G., Hough, S.E., 1984, A model for the shape of the Fourier amplitude spectrum of acceleration at high frequencies: Bulletin of the Seismological Society of America, 74, 1969-1993, doi: 10.1785/BSSA0740051969.

Atkinson, G.M., Boore, D.M., 1995, Ground-motion relations for Eastern North America: Bulletin of the Seismological Society of America, 85, 17-30, doi: 10.1785/BSSA0850010017.

Boore, D.M., 1983, Stochastic simulation of high-frequency ground motions based on seismological models of the radiated spectra: Bulletin of the Seismological Society of America, 73, 1865-1894, doi: 10.1785/BSSA07306A1865.

Boore, D.M., Joyner, W.B., 1997, Site amplifications for generic rock sites: Bulletin of the Seismological Society of America, 87, 327-341, doi: 10.1785/BSSA0870020327.

Boore, D.M., 2003, Prediction of ground motion using the stochastic method: Pure and Applied Geophysics, 160, 635-676, doi: 10.1007/PL00012553.

Brune, J.N., 1970, Tectonic stress and the spectra of seismic shear waves from earthquakes: Journal of Geophysical Research, 75, 4997-5009, doi: 10.1029/JB075i026p04997.

Carrillo-Martínez, M., 1989, Estratigrafía y tectónica de la parte centrooriental del Estado de Querétaro: Revista Mexicana de Ciencias Geológicas, 8, 188-193.

Carrillo-Martínez, M., 1990, Geometría estructural de la Sierra Madre Oriental, entre Peñamiller y Jalpan, Estado de Querétaro: Revista Mexicana de Ciencias Geológicas, 9, 62-70.

Castro, R.R., Pacor, F., Franceschina, G., Bindi, D., Zonno, G., Luzi, L., 2008, Stochastic strong-motion simulation of the Mw 6 Umbria-Marche earthquake of September 1997: Comparison of different approaches: Bulletin of the Seismological Society of America 98, 662-670, doi: 10.1785/0120070092.

Chen, S.Z., Atkinson, G.M., 2002, Global comparisons of earthquake source spectra: Bulletin of the Seismological Society of America, 92, 885-895, doi: 10.1785/0120010152.

Clemente-Chavez, A., Figueroa-Soto, A., Zúñiga, F.R., Arroyo, M., Montiel, M., Chavez, O., 2013, Seismicity at the northeast edge of the Mexican Volcanic Belt (MVB) and activation of an undocumented fault: the Peñamiller earthquake sequence of 2010-2011, Querétaro, Mexico: Natural Hazards and Earth System Sciences, 13, 2521-2531, doi: 10.5194/nhess-13-2521-2013.

Ferrari, L., Orozco-Esquivel, T., Manea, V., Manea, M., 2012, The dynamic historic of the Trans-Mexican Volcanic Belt and the Mexico subduction zone: Tectonophysics, 522-523, 122-149, doi: 10.1016/j.tecto.2011.09.018.

Hanks, T.C, 1979, b values and ω seismic source models: implications for tectonic stress variations along active crustal fault zones and the estimation of high-frequency strong ground motion: Journal of Geophysical Research, 84, 2235-2242, doi: 10.1029/JB084iB05p02235.

Henry, C.D., Aranda-Gómez, J.J., 1992, The real southern Basin and Range: mid to late Cenozoic extension in Mexico: Geology 20, 701-704.

Halldorsson, B., Papageorgiou, A.S., 2005, Calibration of the specific barrier model to earthquakes of different tectonic regions: Bulletin of the Seismological Society of America, 95, 1276-1300, doi: 10.1785/0120040157.

Joyner, W.B., Warrick, R.E., Fumal, T.E., 1981, The effect of Quaternary alluvium on strong ground motion in the Coyote Lake, California, earthquake of 1979: Bulletin of the Seismological Society of America, 87, 327-341, doi: 10.1785/BSSA0710041333.

León-Loya, R.A., 2014, Estado y clasificación de la micro sismicidad en la parte central de la Sierra Madre Oriental: Querétaro, Qro. México, Universidad Nacional Autónoma de México, Tesis de Maestría, 112 pp.

Li, Z., Kotronis, P., Wu, H., 2017, Simplified approaches for Arias Intensity correction of synthetic accelerograms: Bulletin of Earthquake Engineering, 15, 4067-4087, doi: 10.1007/s10518-017-0126-6.

Mavroeidis, G.P., Papageorgiou, A.S., 2003, A mathematical representation of near-fault ground motions: Bulletin of the Seismological Society of America, 93, 1099-1131, doi: 10.1785/0120020100.

Mavroeidis, G., Dong, G., Papageorgiou, A.S., 2004, Near-fault ground motions, and the response of elastic and inelastic single-degree-of-freedom (SDOF) systems: Earthquake Engineering and Structural Dynamics, 33, 1023-1049, doi:10.1002/eqe.391.

Mousavi, M., Zafarani, H., Noorzad, As., Ansari, A., Bargi, K.H., 2007, Analysis of Iranian strong-motion data using the specific barrier model: Journal of Geophysics and Engineering, 4, 415-428, doi: 10.1088/1742-2132/4/4/007.

Nakamura, Y., 1989, A method for dynamic characteristics estimation of subsurface using microtremor on the ground surface: Quarterly Report of Railway Technical Research, 30, 25-33.

Papageorgiou, A.S., 1988, On two characteristic frequencies of acceleration spectra: patch corner frequency and fmax: Bulletin of the Seismological Society of America, 78, 509-529, doi: 10.1785/BSSA0780020509.

Papageorgiou, A.S., Aki, K., 1983a, A specific barrier model for the quantitative description of inhomogeneous faulting and the prediction of strong ground motion. I. Description of the model: Bulletin of the Seismological Society of America, 73, 693-722, doi: 10.1785/BSSA0730030693.

Papageorgiou, A.S., Aki, K., 1983b, A specific barrier model for the quantitative description of inhomogeneous faulting and the prediction of strong ground motion. II. Applications of the model: Bulletin of the Seismological Society of America, 73, 953-978, doi: 10.1785/BSSA0730040953.

Pérez-Moreno, L.F., Rodríguez-Pérez, Q., Zúñiga, F.R., Horta-Rangel, J., Arroyo, M., Pérez-Rea, M. L., Morales-Chico, R., 2021, Coda waves attenuation in the Trans-Mexican Volcanic Belt considering local seismicity: Journal of Seismology, 25, 461-475, doi: 10.1007/s10950-021-09987-y.

Rodríguez-Pérez, Q., 2022, Caracterización estadística de la sismicidad reportada en el Estado de Querétaro: Revista Nthe, Consejo de Ciencia y Tecnología del Estado de Querétaro (CONCYTEQ), 39, 45-50.

Saragoni, G.R., Hart, G.C., 1974, Simulation of artifical earthquakes: Earthquake Engineering and Structural Dynamics, 2, 249-267, doi: 10.1002/eqe.4290020305.

Sato, T., Hirasawa, T., 1973, Body wave spectra from propagating shear cracks: Journal of Physics of the Earth, 21, 415-431, doi: 10.4294/JPE1952.21.415.

Scordilis, E.M., 2006, Empirical global relations converting MS and mb to moment magnitude; Journal of Seismology, 10, 225-236, doi: 10.1007/s10950-006-9012-4.

Singh, S.K.S., Arroyo, D., Pérez-Campos, X., Iglesias, A., Espíndola, V.H., Ramírez, L., 2017, Guadalajara, Mexico, Earthquake Sequence of December 2015 and May 2016: Source, Q, and Ground Motions: Geofísica Internacional, 56, 173-186, doi: 10.22201/igeof.00167169p.2017.56.2.1764.

Suter, M., 1987, Orientational data on the state of stress in northeastern Mexico as inferred from stress-induced borehole elongations: Journal of Geophysical Research, 92, 2617-2626, doi: 10.1029/JB092iB03p02617.

Suter, M., 1991, State of stress and active deformation in Mexico and western Central America, en D.B. Slemmons, et al. (eds.) Neotectonics of North America: Boulder, Colorado, Geological Society of America, Decade Map Vol. 1, 401-1421.

Suter, M., Quintero, O., Johnson, C.A., 1992, Active faults and state of stress in the central part of the trans-Mexican volcanic belt. 1. The Venta de Bravo fault: Journal of Geophysical Research, 97, 11983-11993, doi: 10.1029/91JB00428.

Suter, M., Quintero, O., López, M., Aguirre, G., Farrar, E., 1995a, The Acambay graben:active intra-arc extension in the trans-Mexican volcanic belt, Mexico: Tectonics, 14, 1245-1262, doi: 10.1029/95TC01930.

Suter, M., Carrillo, M., López, M., Farrar, E., 1995b, The Aljibes half-graben active extension in the transition zone between the trans-Mexican volcanic belt and the southern Basin and Range, Mexico: Geological Society of America Bulletin, 107, 627-641,

Suter, M., Carrillo-Martínez, M., Quintero-legorreta, O., 1996, Macroseismic study of shallow earthquakes in the Central and Eastern parts of the Trans-Mexican Volcanic Belt, Mexico: Bulletin of the Seismological Society of America, 86, 1952-1963, doi:10.1785/BSSA0860061952.

Wald, D.J., Quitoriano, V., Heaton, T.H., Kanamori, H., 1999, Relationships between peak ground acceleration, peak ground velocity, and modified Mercalli intensity in California: Earthquake Spectra, 15, 557-564, doi:10.1193/1.1586058.

Zúñiga, F.R., Pacheco, J.F., Guzmán-Speziale, M., Aguirre-Díaz, G.J., Espíndola, V.H., Nava, E., 2003, The Sanfandila earthquake sequence of 1998, Queretaro, Mexico: activation of an undocumented fault in the northern edge of central Trans-Mexican Volcanic Belt: Tectonophysics, 361, 229-238, doi: 10.1016/S0040-1951(02)00606-6.