How to cite: Batista-Rodríguez, J.A., Pérez-Flores, M.A., Almaguer-Carmenates, Y., Blanco-Moreno, J.A., López-Saucedo, F.E., Batista-Cruz, R.Y., 2021, Using electrical resistivity tomography to evaluate the relationship between groundwater potential and tectonism in northeast Mexico: Revista Mexicana de Ciencias Geológicas, v. 38, núm. 1, p. 18-28.
REVISTA MEXICANA DE CIENCIAS GEOLÓGICAS
v. 38, núm. 1, 2021, p. 18-28
DOI: http://dx.doi.org/10.22201/cgeo.20072902e.2021.1.1597
Using electrical resistivity tomography to evaluate the relationship between groundwater potential and tectonism in northeast Mexico
José Alberto Batista-Rodríguez1,*, Marco Antonio Pérez-Flores2, Yuri Almaguer-Carmenates1, Jesús Antonio Blanco-Moreno1, Felipe de Jesús López-Saucedo1, and Ramón Yosvanis Batista-Cruz1
1 Escuela Superior de Ingeniería, Universidad Autónoma de Coahuila, Nueva Rosita, Coahuila, 26800, Mexico.
2 División de Ciencias de la Tierra, Centro de Investigación Científica y de Educación Superior de Ensenada,
carretera Ensenada - Tijuana No. 3918, Zona Playitas, C.P. 22860, Ensenada, Baja California, 22860, Mexico.
* josebatista@uadec.edu.mx
ABSTRACT
The relationship between groundwater potential and tectonic conditions in three sectors of clastic and carbonated sedimentary rocks of northeastern Mexico was identified using electrical resistivity tomography performed in seven transects. The electrical resistivity data were measured using Schlumberger, Wenner and dipole-dipole arrays of the electrodes. Subsequently, the data obtained were combined to carry out a 2D inversion. From interpretation of the electrical resistivity tomography data, several aquifers are located and characterized within varying thicknesses of conglomerates, sandstones and limestones. Additionally, fractures, faults and boundaries between rock types are identified in the obtained 2D models. These structural elements indicate that the aquifers have a strong relationship with the tectonism of the region. Depressed and uplifted blocks are generated through normal faults. The orientations of the inferred fractures and faults fit the structural characteristics of the study region. The aquifers are classified as semi-confined and confined. In clastic materials, these aquifers are classified as granular, while in limestone, they are mainly fractured. Fracture zones that connect most of the aquifers and connect the aquifers with the ground surface are also identified using electrical resistivity tomography. These zones can constitute the main recharge (including contamination) paths to the aquifers. This pollution can be related to livestock and industrial activities, as well as agriculture and mining in the region. Using these results, water wells were drilled to corroborate the identified aquifers.
Key words: electrical resistivity tomography; aquifers; sedimentary rocks; northeastern Mexico.
RESUMEN
Se presenta la relación entre el potencial de agua subterránea y las condiciones tectónicas en tres sectores de rocas sedimentarias clásticas y carbonatadas del noreste de Mexico, utilizando tomografía de resistividad eléctrica en siete transectos. Los datos de resistividad eléctrica se tomaron usando arreglos Schlumberger, Wenner y dipolo-dipolo. Para realizar la inversión 2D, se combinaron los tres conjuntos de datos obtenidos. A partir de la interpretación de los datos de tomografía de resistividad eléctrica se localizaron y caracterizaron varios acuíferos dentro de diferentes espesores de conglomerado, arenisca y caliza. También, en el modelo 2D se identifican fracturas, fallas y límites entre tipos de rocas. Esos elementos estructurales indican que los acuíferos tienen una gran relación con el tectonismo de la región. Bloques hundidos y elevados se presentan asociados a fallas normales. La orientación de las fracturas y fallas inferidas se ajustan a las características estructurales de la región de estudio. Los acuíferos se clasifican como semi-confinados y confinados. En materiales clásticos, estos acuíferos se clasifican como granulares, mientras que en calizas son principalmente fracturados. En las tomografías también se identifican zonas de fracturas que conectan a la mayoría de los acuíferos y, a estos, con la superficie. Esas zonas pueden constituir las principales vías de recarga y contaminación de los acuíferos. La contaminación puede estar relacionada con las actividades ganaderas e industriales, así como con la agricultura y la minería en la región. Usando estos resultados se perforan pozos de agua para corroborar los acuíferos identificados.
Palabras claves: tomografía de resistividad eléctrica; acuíferos; rocas sedimentarias; noreste de México.
Manuscript received: august 22, 2020
Corrected manuscript received: october 27, 2020
Manuscript accepted: october 30, 2020
INTRODUCTION
At present, the availability of drinking water is a very important issue due to the growing scarcity of this natural resource. The decrease in water reserves is mainly related to environmental damage caused by anthropogenic activity. This damage also involves the pollution of superficial water and groundwater (WMO, 2009). Groundwater is located in pores, fractures and cavities of rocks and subsoil materials, mainly in sedimentary rocks. This implies that groundwater has less vulnerability to pollution than surface waters. These water-bearing rocks can be called aquifers and have different characteristics and classifications (Raghunath, 2006).
In arid and semi-arid regions, the availability of water is a big problem (Tangdamrongsub et al., 2017). Most of northeastern Mexico (State of Coahuila) is located within these regions; therefore, in this area, it is very important to analyze the availability of sufficient volumes of water with the required quality. This natural resource is used in different economic activities in this region, mainly associated with industry and urban development, as well as agriculture and livestock (CONAGUA, 2015a, 2015b and 2015c). The rocks of this region have experienced strong tectonic deformation (Goldhammer, 1999) that must be conditioning the characteristics of the aquifer systems.
The aquifers have low electrical resistivity values due to groundwater (Telford et al., 1990). The conductivity is related to the salinity of the water inside the rocks and sediments. As the volume and salinity of the water in these materials increases, the electrical resistivity decreases to values below 1 Ωm. This relationship allows the use of geophysical methods, particularly geoelectrical resistivity, to locate and characterize aquifer systems (Telford et al., 1990; Srinivasamoorthy et al., 2009; Ratnakumari et al., 2012).
The present research was carried out to evaluate the relationship between groundwater potential and tectonic conditions in clastic and carbonate rock environments in northeastern Mexico (Figure 1a) using the 2D interpretation of electrical resistivity tomography.
GEOLOGICAL SETTING
In northeastern Mexico, sedimentary rocks outcrop all around the Sabinas basin. These rocks originated from the Middle-Upper Jurassic to the Quaternary (González-Sánchez et al., 2007). Limestone, sandstone and shale are integrated into different geological formations, which generally were tectonized during the Late Cretaceous and the Tertiary Laramide orogeny (Goldhammer, 1999; Eguiluz de Antuñano, 2001; González-Sánchez et al., 2007). Orogeny-related anticline and syncline folds affected by reverse faulting are characteristics of shortening deformation. The fold axes are mainly NW-SE oriented, suggesting a SW-NE principal stress axis. Locally, NW-SE normal faults and fractures are also observed, as well as lateral displacement faults with similar directions (Goldhammer, 1999; SGM, 2003; Santiago-Carrasco et al., 2008; Armenta-Román et al., 2014).
Cuatrociénegas sector
In the Cuatrociénegas sector, at the western end of the Sabinas basin, sedimentary rocks of the Early and Late Cretaceous, as well as Quaternary alluvium, outcrop (Figure 1b). In this sector, the oldest rocks are represented by fossiliferous limestone of the types wackestone-packstone and grainstone. These rocks have medium and massive stratification, as well as flint nodules and stylolites, and belong to the Aurora Formation of Early Cretaceous age, specifically the Albian (Goldhammer, 1999). Intercalations of gray calcareous shale and clayey limestones of mudstone and wackestone type were deposited above this formation during the middle-upper Albian (Kiamichi Formation; Winker and Buffler, 1988). Later in the Late Cretaceous, several geological formations were deposited, such as the Georgetown, Del Río and Buda formations that make up the Washita Group. The Georgetown Formation is composed of micritic limestones with a thick stratification and flint nodules, as well as small shale intercalations. The Del Río Formation contains fine-grained shale and sandstone, whereas the Buda Formation has calcareous lodolite (Eguiluz de Antuñano, 2001). Quaternary alluvium was deposited above these formations.
This sector is located in a syncline with NW-SE orientation, limited to the SW by the La Madera anticline and to the NE by the Agua de Enmedio anticline located in La Menchaca mountain range (Armenta-Román et al., 2014). A portion of this last structure is shown on the geological map of the sector (Figure 1b). Both anticlines are symmetrical with a NW-SE orientation, mainly. Some Cretaceous formations, such as the Aurora Formation and the Kiamichi Formation, outcrop in these structures. These structural characteristics allow the groundwater to flow towards the syncline, in which colluvial and alluvial sediments outcrop. 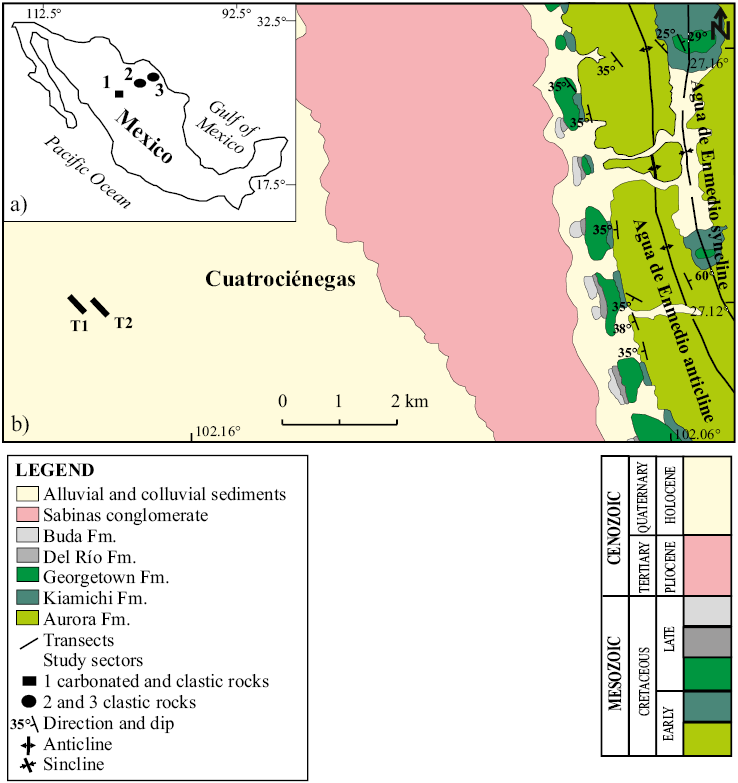
Figure 1. a) Location of the study sectors. Aquifers in carbonated rocks: 1 indicates the Cuatrociénagas sector. Aquifers in clastic rocks: 2 indicates the Nueva Rosita sector and 3 indicates the Guerrero sector. b) Geological map of the Cuatrociénegas sector (modified from Armenta-Román et al., 2014). Original scale was 1:50000. The stratigraphic column is not to scale. Straight lines indicate the location of electrical resistivity tomography transects T1 and T2.
Nueva Rosita sector
The Nueva Rosita sector is located towards the center of the Sabinas basin; it contains sedimentary rocks and an alluvium outcroppings with ages ranging from the Late Cretaceous to the Quaternary (Figure 2). In this sector, the rocks of the Olmos Formation are the oldest, with Campanian-Maastrichtian ages. These are represented by coarse-to-medium grained sandstone with shale, siltstone and carbonaceous shale, which sometimes host coal rocks (Padilla y Sánchez, 1986; Eguiluz de Antuñano, 2001). During the Pliocene, the Sabinas Formation (Sabinas Conglomerate) was deposited above these rocks. This geological formation is composed of an oligomictic conglomerate represented by sand and gravel of fluvial origin containing fragments of limestone (SGM, 2003). Much of the area is covered by Quaternary alluvium.
The Nueva Rosita sector is located on a NW-SE orientated syncline, which is covered by alluvial sediments and conglomerates (SGM, 2003). This structure is linked to faults with a NW-SE orientation that control the channels of the Alamos and San Juan rivers (Figure 2). Late Cretaceous formations outcrop in these structural highs, mainly the Olmos Formation to the NE of the sector; the strata of this geological formation dip to the SW with dips between 5° and 14°. To the SW, the same formation dips towards the NE with an approximate dip of 11°. These structural characteristics allow the flow of groundwater to the study sector.

Figure 2. Geological map of the Nueva Rosita sector (modified from SGM, 2003). Original scale was 1:50000. The stratigraphic column is not to scale. Straight lines indicate the location of electrical resistivity tomography transects T3 and T4.
Guerrero sector
The Guerrero sector is located in the northeast area of the study region, outside the Sabinas basin. Sedimentary rocks and alluvial sediments outcrop in this sector; they originated during the Mesozoic and Cenozoic (Figure 3). Outcrops of the Olmos, Escondido and Midway formations and the Sabinas Conglomerate are found in this sector. These geological formations are constituted of detrital and detrital-carbonated rocks, such as sandstone, limestone, shale, and conglomerates (Santiago-Carrasco et al., 2008). In this sector, the Olmos Formation and the Sabinas Conglomerate have similar characteristics to those described in the Nueva Rosita sector. The Escondido Formation, composed of intercalated layers of sandstone, shale, and siltstone, was deposited on top of the Olmos Formation during the Late Cretaceous (Maastrichtian) (Padilla y Sánchez, 1986). At the beginning of the Cenozoic, in the Paleogene, the Midway Formation was deposited, which is composed of deep-sea shale (Eguiluz de Antuñano, 2001). Overlying the Midway Formation, the Sabinas Conglomerate was deposited. In much of this sector, alluvial sediments were also deposited.
This sector is related to the Bravo anticline, which is located east of the San Patricio river and west of the Bravo river (Santiago-Carrasco et al., 2008; Figure 3). This structure is asymmetric and has a N-S orientation. The Escondido Formation outcrops in this sector. The dip of the stratigraphic sequence decreases to the north and south of the anticline. This may be related to the immersion of the fold axis or to a possible fault with an E-W orientation located in the channel of the San Patricio river. This fault could abruptly interrupt the sequence of the Escondido Formation. 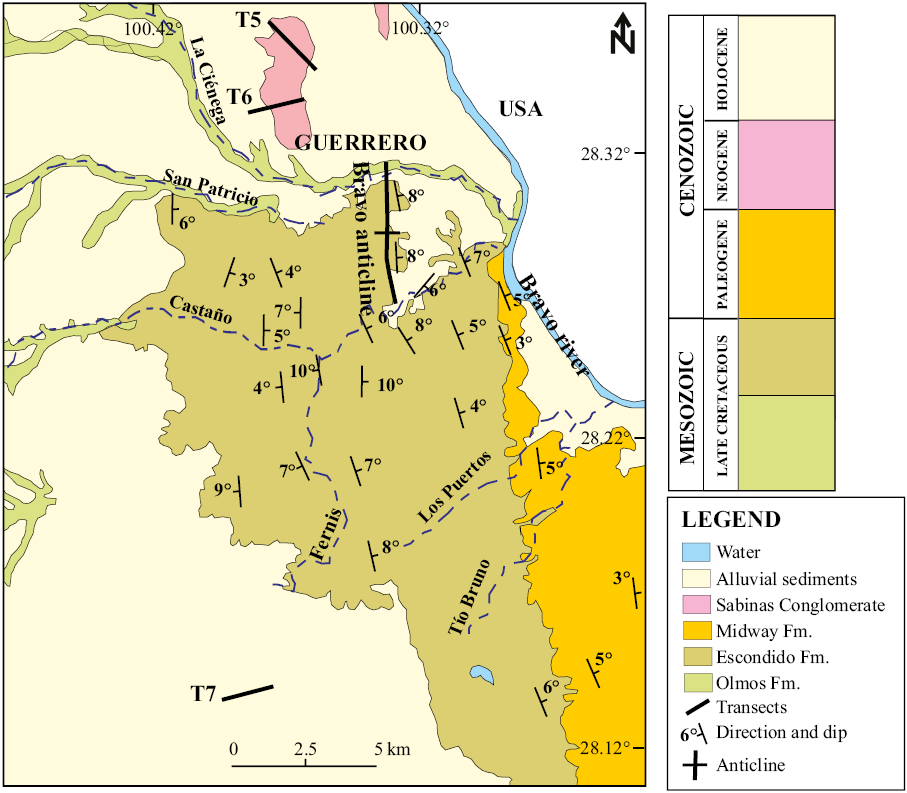
Figure 3. Geological map of the Guerrero sector (modified from Santiago-Carrasco et al., 2008). Original scale was 1:250000. Straight lines indicate the location of electrical resistivity tomography transects T5, T6 and T7. The stratigraphic column and the transects are not to scale.
HYDROGEOLOGICAL CHARACTERISTICS OF THE REGION
According to the Comisión Nacional del Agua (CONAGUA, 2015a, 2015b and 2015c), the study region covers three main aquifers: the Cuatrociénegas-Ocampo, the Carboniferous Region and the Allende-Piedras Negras.
Cuatrociénegas-Ocampo aquifer
The Cuatrociénagas sector is located within the Cuatrociénegas-Ocampo aquifer, which is composed of two aquifer systems (CONAGUA, 2015a). The first and the deepest is established in calcareous and clays-calcareous rocks (e.g., the Austin Formation, the Washita Group and the Aurora Formation), which are located in the mountains and on the valley’s edges. These rocks have very variable primary porosity and permeability, which are related to their original environment. Its secondary porosity and permeability have been intensively developed, and they are related to rock dissolution processes, folding and fracturing. In this aquifer, drilled wells report depths from a few meters to up to 1000 m.
The second aquifer system is the shallowest, and it is located in the topographically lower valley areas, presenting a large territorial extension with a variable thickness between a few meters and up to 120 m. It is composed of poorly consolidated clastic materials of varied granulometry, such as gravel and sand, which provide a medium to high permeability.
Both aquifer systems are hydraulically connected through fractures, forming a single aquifer unit. This aquifer is recharged mainly through fractures, stratification planes and cavities in the limestone that appear on the flanks of the mountains. The natural recharge, estimated around 57.9 hm3/year, is considered poor due to scarce rain and high evaporation. Only in the alluvial fans and along the main streams, a fraction of the recharge originates where the runoff is concentrated in coarse materials with high infiltration capacity (CONAGUA, 2015a). In this region, groundwater is used mainly for agriculture.
Carboniferous Region aquifer
The Nueva Rosita sector is located within the Carboniferous Region aquifer, which has two recognized aquifer systems (CONAGUA, 2015b). In this region, groundwater is used mainly for agriculture and livestock. The first aquifer system is located in Early Cretaceous limestones, mainly in the Cupido and Aurora formations, southeast of the Santa Rosa mountains in Coahuila. Several water wells indicate that this aquifer system is the deepest (about 800 m), and it is classified as mainly confined, although in some sites where limestones outcrop (e.g., the Santa Rosa mountains), this aquifer is of the unconfined type. The permeability in this aquifer system is related to fractures and the chemical dissolution of the rocks. Groundwater recharge (natural + induced) is estimated around 84.1 hm3/year (CONAGUA, 2015b) and produced through the infiltration of rainwater in the mountainous areas (Sanchez et al., 2018).
The second aquifer system is formed by shallow aquifers that are mainly located in materials that fill the Sabinas river valley, such as the Quaternary alluvium and the Sabinas Conglomerate (Pliocene). This system also includes fractures and weathering zones within the conglomerate. This aquifer system is located in granular materials (alluviums and conglomerate) and it is classified as unconfined, while the system in the Late Cretaceous sedimentary rocks is semi-confined. According to Sanchez et al. (2018), in these aquifers in granular materials water may seep down through fractures to the Late Cretaceous formations (e.g., the Buda, Eagle Ford, Austin, Upson, San Miguel, Olmos and Escondido Formations). In particular, the Olmos Formation aquifers are considered aquitard because they store fluids, but with low permeability. This aquifer has a thickness of 15 to 40 m, and its static level can range from 5 to 15 m. Its base is defined as the depth at which rock fracturing is reduced or where fractures are clay or calcite filled (CONAGUA, 2015b). This second aquifer system is the most important for this research, because only electrical resistivity tomography can reach the depths where this system is located.
Allende-Piedras Negras aquifer
The Guerrero sector is located within the Allende-Piedras Negras aquifer, which is also composed of two aquifer systems, one superficial and one deeper (CONAGUA, 2015c). The deeper aquifer is in limestones from the Early Cretaceous at El Burro mountain. This aquifer is recharged on the mountain and is classified as a confined and semi-confined aquifer. The shallower aquifer system is located towards the Allende-Piedras Negras plain in the Sabinas Conglomerate (Sanchez et al., 2018), and its static level varies between 5 and 30 m. The total recharge received by the aquifer is around 496.5 hm3/year (CONAGUA, 2015c). Both aquifer systems are hydraulically connected through fractures. In this region, groundwater has agriculture and industrial uses.
METHODOLOGY FOR ACQUISITION AND PROCESSING OF ELECTRICAL RESISTIVITY DATA
In each study sector, several electrical resistivity tomography (ERT) studies were performed. Specifically, in Cuatrociénegas, Nueva Rosita and Guerrero, the measurements were taken on two, two and three transects, respectively (Figures 1b, 2 and 3). The transect locations are based on geological, topographic and vegetation characteristics. All transects were located in areas with flat relief and easy access. The data were taken during the dry season using an AGI SuperSting R1/IP/SP (AGI, 2006) with 28 electrodes and with 10 and 20 m spacing for Schlumberger, Wenner and dipole-dipole arrays. With these characteristics, the transects reached lengths of 270 and 540 m, and the ERT reached depths close to 60 and 120 m.
The EarthImager 2D resistivity inversion software developed by Advanced Geosciences, Inc. (AGI, 2009) was used to process the data. Smooth model inversion was the inversion method used because of their stable and robust behavior, therefore, it is recommended for all types of data (AGI, 2009). We put together the three arrays of data and we did a joint inversion in order to get a single 2D resistivity model for every site. In each ERT, we show the outcrops in order to facilitate the lithological interpretation. We also show the wells drilled before the ERT survey. We found water saturated zones corresponding with low resistivity values in the resistivity models. These zones can be considered aquifers, and therefore, we can infer their geometry, extensions, depths and thicknesses and each aquifer type (Kovalevsky et al., 2004; Srinivasamoorthy et al., 2009; Sequeira-Gómez and Escolero-Fuentes, 2010; Ratnakumari et al., 2012). We can also infer fractured zones (Obiadi et al., 2012; Barriga-Paria and Barriga-Gamarra, 2018; Szalai et al., 2018). The interpretation of the ERT concludes with a proposal of wells to drill for aquifer exploitation.
RESULTS
In the state of Coahuila, three sectors were explored, in which hydrogeological characteristics indicate that groundwater is located in zones with different geological backgrounds, such as in carbonate or clastic sedimentary rocks (CONAGUA, 2015a, 2015b and 2015c).
Groundwater in carbonated sedimentary rocks
Sector 1: Cuatrociénegas
In this sector, there are two NW-SE transects where alluvial sediments and limestone outcrop. These transects have a length of 400 m, and each ERT reaches down to approximately 70 m depth, with electrical resistivity values between 1.4 and 254 Ωm (Figures 4 and 5). Resistivity values below 15 Ωm show sub-horizontal zones that outcrop or are located at different depths (A, B, C, D and E in Figure 4 and Figure 5). On surface, these zones are related to alluvial sediments.
From the resistivity models, we can also see three resistivity groups: below 15 Ωm, from 15 to 30 Ωm and high resistivities that reached 254 Ωm. The two transects have water wells with depths between 40 and 58 m. These wells were drilled before this research.
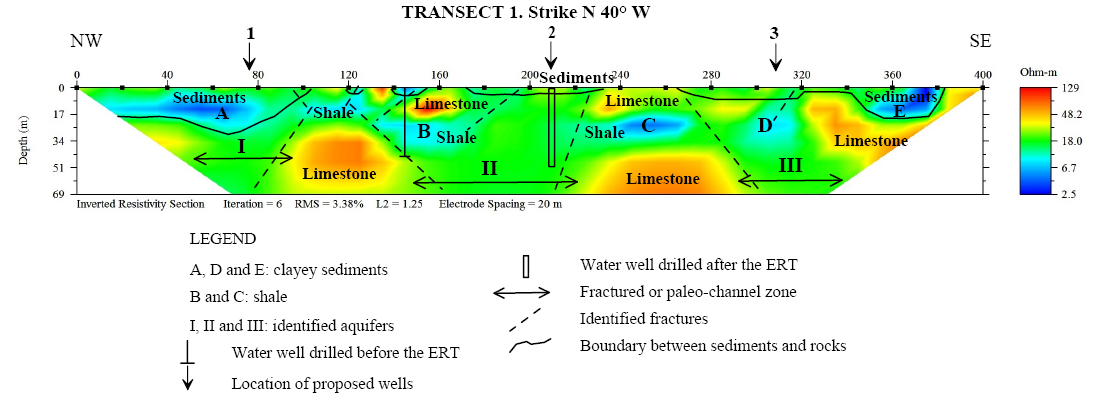
Figure 4. Electrical resistivity tomography 2D model of transect 1 located in the Cuatrociénegas sector.
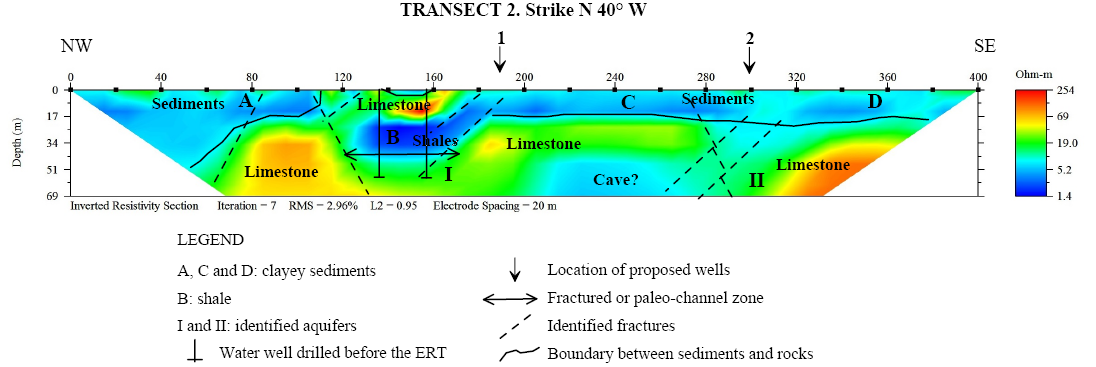
Figure 5. Electrical resistivity tomography 2D model of transect 2 located in the Cuatrociénegas sector.
Groundwater in clastic sedimentary rocks
Sector 2: Nueva Rosita
In both transects of the Nueva Rosita sector, conglomerate and alluvial sediments outcrop. Transect 3 has a length of 270 m and transect 4 has a length of 540 m (Figures 6 and 7). In these ERTs, the resistivity values vary from 2.9 to 2671 Ωm, showing both lateral and vertical changes of resistivity values. We can distinguish several resistivity groups: those with a resistivity of 15 Ωm and lower cover most of the 2D model. On the surface, the lower values group is related to alluvial sediments. There is one group with resistivity values from 20 to 60 Ωm (transect 3; Figure 6) and another group with values from 70 to 200 Ωm (transect 4; Figure 7). In both transects, there are water wells with depths between 20 and 43 m. These wells were drilled before the ERT survey was performed.
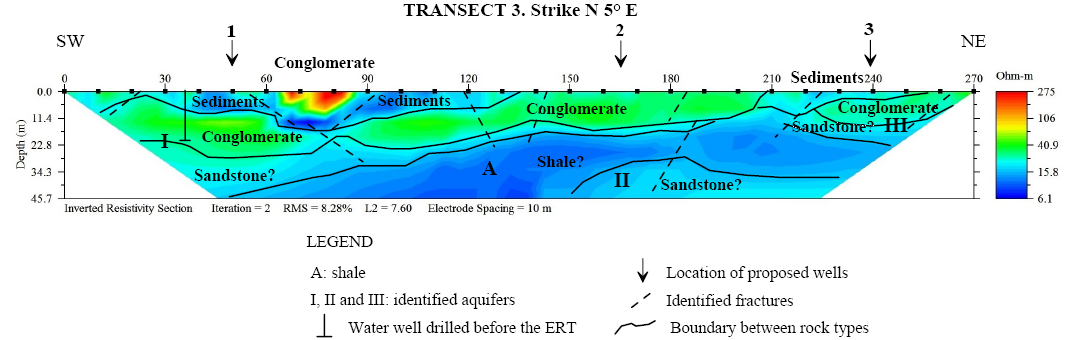
Figure 6. Electrical resistivity tomography 2D model of transect 3 located in the Nueva Rosita sector.
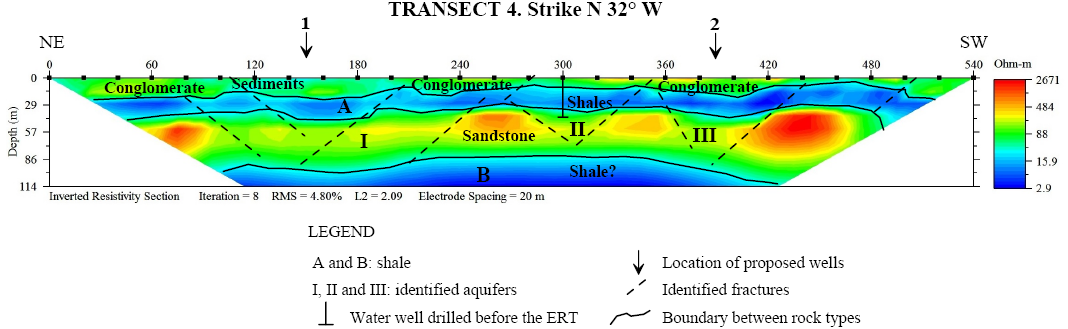
Figure 7. Electrical resistivity tomography 2D model of transect 4 located in the Nueva Rosita sector.
Sector 3: Guerrero
In the Guerrero sector, three transects were obtained in which sandstone, conglomerate and alluvial sediments outcrop (Figures 8, 9 and 10). Two transects are 270 m long (Figures 9 and 10) and the third is 540 m long (Figure 8). In these ERTs, the electrical resistivity values vary between 3.9 and 157 Ωm, and zones are defined by values lower than 15 Ωm. Generally, these zones overlay other zones with resistivity values between 20 to 60 Ωm. Resistivity looks uniform inside every zone, but there is a little lateral and vertical change in the resistivity. At transect 6, there is a water well, which was drilled before the ERT. This well is 17 m in depth. 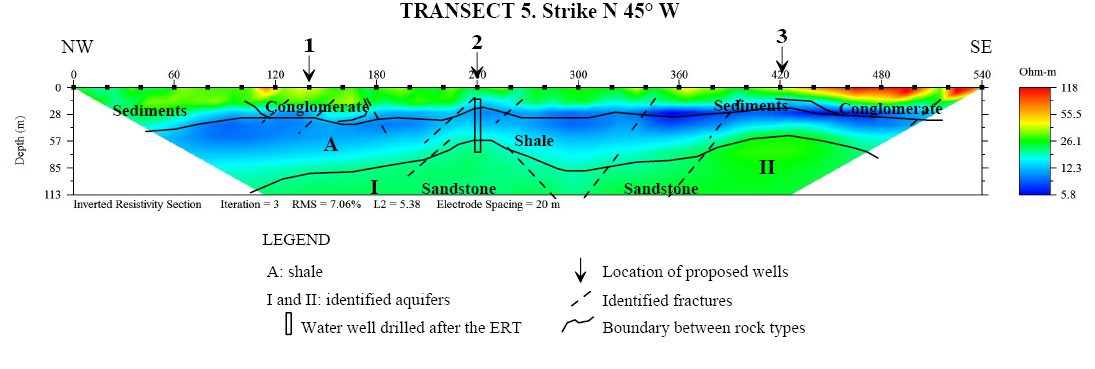
Figure 8. Electrical resistivity tomography 2D model of transect 5 located in the Guerrero sector.
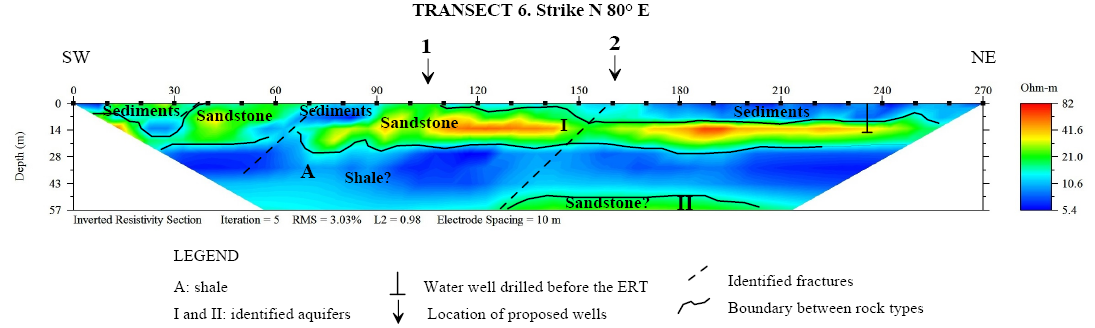
Figure 9. Electrical resistivity tomography 2D model of transect 6 located in the Guerrero sector.
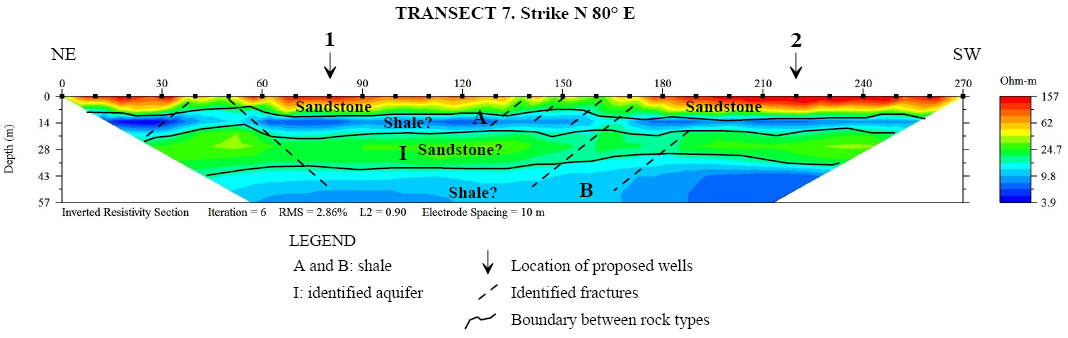
Figure 10. Electrical resistivity tomography 2D model of transect 7 located in the Guerrero sector.
DISCUSSION
In order to locate and characterize aquifers in the geoelectrical sections, we assumed that aquifers are low resistivity bodies delimited by high resistivities due to carbonated sedimentary rocks (sector 1). But also, high resistivity bodies delimited by low resistivities due clastic sedimentary rocks (sector 2 and 3; Srinivasamoorthy et al., 2009; Sequeira-Gómez and Escolero-Fuentes, 2010; Ratnakumari et al., 2012). Water wells drilled before and after the ERT corroborate the identified aquifers.
Cuatrociénegas sector
The lateral resistivity changes in the Cuatrociénegas sector indicate the possible upward and downward blocks through normal faults. Instead of downward blocks, there may also be fractured limestones (Robert et al., 2011; Demirel et al., 2018) or paleo-channel zones (dissolution zones; Nimnate et al., 2017). Low resistivity values in limestone (15–30 Ωm) indicate water saturation, and therefore, indicate the location of the carbonate aquifer (Figures 4 and 5). In some cases, aquifers are underlain by clayey sediments or shale with resistivities lower than 15 Ωm.
In transect 1, three aquifers can be identified at 40 m deep (I, II and III in Figure 4). The aquifers are underlying clayey sediments or shale. These sediments are located in three zones (A, D and E in Figure 4), possibly filling fractures and cavities in carbonate rocks. The geometry of zone D indicates a possible cavity filled with sediments. According to the stratigraphy of the region, the aquifer may be located in the Georgetown Formation limestones on the Washita Group.
There are shale intercalations (B and C zones in Figure 4) in this geological formation.
A water well with 40 m depth static level is located at position 143 m in transect 1 (Figure 4). This well corroborates the zone II aquifer. Above aquifers I and III, there is a zone of very low resistivity associated with clayey sediments and shale. The lateral changes in resistivity indicate that the three aquifers have also lateral changes in porosity and permeability in limestones. These lateral changes of resistivity must be considered in order to locate the water wells in this area. Almost all these zones of clayey sediments or shale are connected with the land surface through fractures, according to the resistivity lowering on the model. Some identified fractures can also be related to limestones and may be the main recharging zones for the aquifers.
The resistivity distribution also indicates the locations of less saturated zones, where the limestones must be little weathered and fractured, according to their highest resistivity values (Figure 4). We also see a possible structural change or movement between blocks through faults. The supposed lower blocks (paleo-channel or fractured zone) are located around x = 80 m, x = 180 m, and x = 310 m on transect 1, whereas the higher blocks are shown around x = 120 m and x = 240 m.
These proposed structures determine the distribution of groundwater and therefore, the general characteristics of the aquifers, such as shape, depth, length, and thickness. Then, we propose three water wells with a minimum depth of 40 m (1, 2 and 3 in Figure 4). The first well should be at x = 76 m, the second should be at x = 210 m and the third should be at x = 310 m. Well 2 was selected to be drilled, and it deepened until 48 m. Initially, the well cuts sediments and then cuts fractured limestone, and static water level equal to 45 m. This result indicates the extension of aquifer II to the SE. The resistivity model fits very well with the drilling results.
Transect 2 shows a model with large resistivity changes that suggest the upward and downward movement of blocks. We can observe two aquifers that can be associated with a fractured or paleo-channel zone in limestones of the Georgetown Formation (I and II in Figure 5). These aquifers are under conductors lower than 10 Ωm (indicated as A, B, C and D in Figure 5). These conductors are associated with alluvial clayey sediments that outcrop along the transect and with shale in the Georgetown Formation.
Aquifer I is near the center of transect 2 (Figure 5), within limestones, under a shale layer, according to information from two wells drilled before the ERT survey. Both wells reached 60 m depth and are located at x = 135 and x = 158 m. The distribution of the shale intercalations above this aquifer indicates possible faults causing upward and downward movement through the limestone strata. Those fractures must be filled with conductive clayey sediments and, therefore, the resistivity decreases.
Aquifer II is located at the SE end of transect 2, and it is overlain by clayey alluvial sediments or shale (Figure 5). The distribution of conductors indicates that the NW end of this aquifer is located next to a possible cave more than 80 m in diameter. The cave was delimited on the basis of its oval geometry and low resistivity values (5 to 12 Ωm). Between the aquifer and the cave, there is a highly fractured zone. The fractures allow the connection between sediments and the deeper limestones. Therefore, these fractures and cavities are filled with clayey sediments.
In general, the resistivity distribution in transect 2 (Figure 5) suggests a tectonized geologic section, where depressed and uplifted blocks are distinguished by faults (sharp resistivity changes). Some blocks are identified in zones with high resistivity values that indicate limestones with less fracturing or karstification. The same situation happens between x = 120 and x = 160 m.
We propose two wells for water extraction (indicated as 1 and 2 in Figure 5). The first well is located at x = 190 m with a depth greater than 50 m. The second well is at x = 300 m, reaching more than 55 m deep.
The Cuatrociénegas sector has aquifers whose origins and characteristics are closely related to the tectonic evolution of the region. The aquifers are located in limestones of the Georgetown Formation, indicating that the storage capacity of this formation is related to karstification and fractures created by the regional stress structures (NW-SE) associated with the folding of the sedimentary sequence.
Due to the orientation of the transects (NW-SE; Figure 1b), the identified fractures and normal faults in the 2D models have a NE-SW orientation. Perhaps, through these faults, river channels have been developed, and these channels flow from the mountain ranges and cross-cut the anticline axes. Those fractures and faults (mainly those delimiting the blocks) are dipping towards the NW and SE. In transect 1, the inferred dips to the NW are relatively high, possibly higher than 60°. Towards the SE, these dips are lower, possibly around 40°. In transect 2, the dips to the NW and SE are also relatively high, potentially higher than 40°. In this last transect, the shales located between x = 120 m and x = 170 m have an approximately 45° dip to the NW. Also, the shallower limestones, located between x = 185 m and x = 400 m, lie horizontally. These inferred dips of the strata fit in to the described structural characteristics in the area surrounding the study sector (Armenta-Román et al., 2014). The high dips identified in the models, as well as the stepped morphology in the La Madera and La Menchaca mountain ranges, can be explained by the normal nature of these faults.
The locations of the identified aquifers in the stratigraphic sequence and the hosting lithologies allow us to classify them as confined to semi-confined. The aquifers’ potential is related to the large secondary porosity that is a result from the fracturing of carbonate rocks (CONAGUA, 2015a). These kinds of aquifers resemble the Edwards aquifers in carbonate rocks in the United States, which have good to moderate aquifer potential and good to moderate water quality (Sanchez et al., 2018).
Nueva Rosita sector
In the Nueva Rosita sector, the estimated resistivity distribution suggests tectonically altered rocks. It is possible that these clastic sedimentary rocks have grain size variations (facies changes) that determine the porosity and permeability behavior and therefore, the resistivity values (Sequeira-Gómez and Escolero-Fuentes, 2010). The effect of tectonism is shown through fractures and faults identified on the 2D models (Figures 6 and 7). Particularly, in transect 4, slightly vertical block movements are inferred from the interpreted normal faults (Figure 7). The subsided blocks can indicate highly fractured rocks or a paleo-channel zone (Robert et al., 2011; Nimnate et al., 2017; Demirel et al., 2018).
Using the resistivity distributions, several aquifers are identified in the Nueva Rosita sector, specifically, where resistivity ranges from 20 to 60 Ωm in transect 3 (Figure 6) and from 70 to 200 Ωm in transect 4 (Figure 7). Those resistivity values indicate clastic rocks of medium to high granulometry that are water saturated. These rocks are sandstones from the Olmos Formation and conglomerates from the Sabinas Formation. Generally, these aquifers are underlying clayey sediments or shales with low resistivity values (conductors).
Transect 3 is in the NE of the region (Figure 2). The 2D resistivity model deepens to 50 m, and three aquifers were identified (Figure 6). The two shallower aquifers are located in the Sabinas Conglomerate and the sandstones of the Olmos Formation (I and III). Both aquifers are located in the lower level of the Sabinas Conglomerate and the upper level of sandstones in the Olmos Formation. The deepest aquifer is within the deeper level of the sandstone from Olmos Formation (II in Figure 6). In the conglomerate, several fracture zones are identified, which apparently connect this first aquifer with the land surface. Similarly, several fracture zones connect the aquifers. Therefore, these fractures may be the main recharge route between aquifers. The shallower aquifers are covered by conglomerate and clayey sediments. Low resistivity in the area covered by clayey sediments (between x = 30 and x = 130 m) indicates possible paleochannels. The upper aquifer is located below an area of very low resistivity (conductor A in Figure 6). This area must be composed of shales from the Olmos Formation. Considering the distribution of fine grain clastic materials, the three aquifers can be classified as confined to semi-confined. A water well with a depth of 20 m is located at x = 35 m and corroborates the location of aquifer I.
With the transect 3 resistivity model, we propose the location for three water wells (1, 2 and 3 in Figure 6). The first well is located at x = 50 m, with the purpose to locate aquifer I at approximately 20 m depth. The second water well is located at x = 165 m, with the main purpose of locating aquifer II at 35 m depth. Finally, well 3 is located at x = 240 m; this well has the purpose of locating the water table at 10 m depth.
Transect 4 is in the SW of the area (Figure 2), and its resistivity model obtained reaches 115 m depth and shows three aquifers in the Olmos Formation sandstone (I, II and III in Figure 7). These aquifers are possibly located in paleo-channel zones delimited by high resistivity sandstone blocks. The blocks are raised through normal faults. The existence of aquifer II is validated by the water well located at x = 300 m.
These aquifers are underlying some conductors composed of clayey sediments or shale from the Olmos Formation. Therefore, this aquifer can be classified as confined to semi-confined.
Based on the transect 4 resistivity model, we suggest two locations for water wells, x = 150 and x = 390 m (Figure 7). Well 1 must locate the aquifer I at z ≅ 50 m depth, whereas well 2 should locate aquifer III at z ≅ 55 m depth.
The fractures and faults identified on the 2D models have a NW-SE orientation and may be linked to normal faults with the same orientation. Such faults determine the morphology of the channels of the Álamos and San Juan rivers (Figure 2). The identified structures in the 2D models dip toward the NE and SW, with dips that may be higher than 40°. In transect 3, the layers of the Olmos Formation (sandstone and shale) have a low dip to the SW (approximately 15°), whereas in transect 4, these layers lie horizontally. Toward the SW, the identified structures have the same dips shown in the rocks in the surroundings of the sector (SGM, 2003).
The water storage capacity of the aquifers in the Nueva Rosita sector is related to lateral granulometric variations (possible facies changes) linked to paleo-channel deposits, which can increase the porosity and the stored water volume. It is also possible that the porosity is related to the tectonic deformation shown in the resistivity models, mainly in transect 4. According to Sanchez et al. (2018), the Olmos Formation has poor aquifer potential and poor water quality, whereas the conglomerate (Sabinas Formation) has moderate aquifer potential and freshwater.
Guerrero sector
The resistivity models in the Guerrero sector were used to identify some aquifers (Figures 8, 9 and 10). These aquifers are located in clastic rocks (sandstone) according to the drilling, and such lithologies outcrop along the transects and their surroundings. We show that resistivity values of these aquifers vary between 20 and 60 Ωm. All these aquifers underlie a very low resistivity layer, possibly clayey sediments or shale from the Olmos Formation. Due to these characteristics, these aquifers are classified as confined to semi-confined. The geometry and distribution of the aquifers suggest a relationship with tectonics. From surface evidence, we can infer that there are deepening fractures or faults in the resistivity models.
Transect 5 is located at the north end of this sector, where conglomerate and alluvial sediments outcrop. Beneath these outcrops, there is a very low resistivity zone (A in Figure 8) associated with shales from the Olmos Formation. This zone overlays sandstone that hosts two aquifers, delimited between 20 and 40 Ωm.
After the model analysis in transect 5, three water wells are projected. Wells 1, 2 and 3 are located at x = 140, 240, and 420 m, respectively. The first well is located at depths of z ≅ 85 m, the second well is located at z ≅ 55 m and the third well is located at z ≅ 50 m. From results of this research, well 2 was selected and drilled until z = 57 m, and water was found in the sandstone. This well corroborated the location of aquifer I, and the resistivity model indicates a lateral continuation of this aquifer. Aquifers I and II are laterally separated by a low resistivity body, possibly associated with fractures or faults. Such structures extend to the surface, affecting the conglomerate.
In transect 6, using resistivities between 20 and 40 Ωm, two aquifers are identified (I and II in Figure 9). Both are located in sandstone and at different depths. Both aquifers are separated by a low resistivity layer or shale from the Olmos Formation. Aquifer I is the shallowest, and it is at approximately 10 m depth, underlying clayey sediments. The sandstone layer of this aquifer is approximately 15 m thick. From the resistivity model, we can see that the aquifer has a lateral discontinuity related to fractures or faults. A previously drilled well located at the position x = 235 m corroborates the location of this aquifer. Aquifer II is at z = 50 m depth. This aquifer is limited at its SW end by a fracture or fault system that also affects the shallower aquifer I. Both aquifers are classified as confined or semi-confined.
From the transect 6 model analysis, we can suggest two water wells: one at x = 105 m and another at x = 162 m. The first well is at 10 m depth and in aquifer I. The second suggested well would reach both aquifers; specifically, it would intersect aquifer I at z = 10 m depth and aquifer II at z = 55 m depth.
In transect 7, the resistivity model shows only one aquifer (Figure 10) inside the sandstone in the Olmos Formation. The aquifer’s resistivity is between 20 and 52 Ωm, and it also contains lateral discontinuities because of tectonism or facies changes. This aquifer is underlain and overlain by conductors (A and B in Figure 10) that must be shales from the Olmos Formation. Therefore, the aquifer is classified as confined. From the resistivity model, we can suggest two water wells to be drilled with more than 14 m depth, at x = 80 m and x = 220 m.
According to the orientation of the three transects (Figure 3) and the fractures or faults identified on the 2D models, we have two main orientations, NW-SE and NE-SW, and they may be related to normal faults in both directions. These faults determine the directions of San Patricio, Castaños, Los Puertos, Fernis and Tío Bruno rivers. The identified structures have a dip of ~45° (view Transect 5; Figure 8). In the SW and NE directions, the structures have a dip of ~45°. The SW dips are similar to those dips of the faults shown on the geological sections of the region (Santiago-Carrasco et al., 2008). The three models show sub-horizontal layers of sandstone and shale from the Olmos Formation. This is the main layering type in the sector and its surroundings (Santiago-Carrasco et al., 2008).
The fractures and faults with NW-SE and NE-SW orientations identified in the 2D model agree with the conceptual model of fracture development proposed by Gottardi and Mason (2018). The identified fracturing of the three studied sectors causes a porosity and permeability increase and therefore, an increase in the water volume inside the rocks and a resistivity decrease compared with dry rocks (Telford et al., 1990, Srinivasamoorthy et al., 2009; Ratnakumari et al., 2012). These fractured zones can be recharge conduits, according to CONAGUA (2015a), but they can also be conduits of pollution (Obiadi et al., 2012) derived from agriculture, livestock, industry and mining activities.
CONCLUSIONS
From electrical resistivity tomography (ERT) in carbonated and clastic sedimentary environments in the Cuatrociénegas, Nueva Rosita and Guerrero sectors, several aquifer systems were identified and characterized. The most favorable sites for drilling water wells in these aquifers were proposed. Previously drilled wells in some of the transects confirm the presence of groundwater in the zones and depths suggested by ERT, and therefore, they validate this geophysical technique to locate and characterize this natural resource used in agriculture, livestock, industry and mining in the region studied. The results indicate several aquifers within conglomerates, sandstone and limestone that have a strong relationship with regional tectonism. In 2D models, fractures and faults with NW-SE and NE-SW orientation that are related to normal faulting were identified. These structures limit the supposed depressed and uplifted blocks associated with normal faulting. The lower blocks can indicate fractured limestones or paleo-channel zones. The orientation and dips of these structures coincide with the structural characteristics of the study sector and their surroundings. The identified aquifers can be classified as semi-confined to confined. Some aquifers have large variations in thickness and depth. Generally, these aquifers are connected to each other through fracture systems and are also connected with the surface. In these cases, the fractures can be their main recharge routes, and at the same time, possible routes of pollution, due to economic activities in each of the study sectors. Also, the resistivity values in the ERT of the three studied sectors help us to identify geological materials and therefore, to infer the geological structure in all ERT studies.
ACKNOWLEDGMENTS
We thank the Universidad Autónoma de Coahuila and particularly the Facultad de Ingeniería for their support of this research. Two anonymous reviewers made constructive suggestions that highly improved this manuscript.
REFERENCES
AGI (Advanced Geosciences, Inc), 2006, Manual de Instrucciones para SuperSting TM con sistema de resistividad automática SwiftTM y PI. SuperSting R1/PI versión 01.01.38, 87 pp.
AGI (Advanced Geosciences, Inc), 2009, Instruction Manual for EarthImager. Version 2.4.0. Resistivity and IP Inversion Software, 139 pp.
Armenta-Román, R., Guzmán-Lugo, A., Gómez-Nava, J.A., Armenta de la Cruz, S., 2014, Carta geológico-minera La Victoria G13-B49. Coahuila: Servicio Geológico Mexicano, Cartas geológicas de México serie 1: 50,000, 1 map with text.
Barriga-Paria, Ch.J., Barriga-Gamarra, J.P., 2018, Identification and evaluation of fractures using electrical resistivity tomography in the vecinity of the axis of the Huamantanga Dam – Lima - Peru: Revista Brasileira de Geofísica, 36(2), 111-122.
CONAGUA (Comisión Nacional del Agua), 2015a, Actualización de la disponibilidad media anual de agua en el acuífero Cuatrociénegas-Ocampo (0504) Estado de Coahuila (on line): Subdirección General Técnica. Gerencia de Aguas Subterráneas, Subgerencia de Evaluación y Ordenamiento de acuíferos, <https://www.gob.mx/cms/uploads/attachment/file/102841/DR_0504.pdf> query date: august 13th 2020.
CONAGUA (Comisión Nacional del Agua), 2015b, Actualización de la disponibilidad media anual de agua anual en el acuífero Región Carbonífera (0512) Estado de Coahuila (on line): Subdirección General Técnica, Gerencia de Aguas Subterráneas. Subgerencia de Evaluación y Ordenamiento de acuíferos, <https://www.gob.mx/cms/uploads/attachment/file/102852/DR_0512.pdf> query date: august 13th 2020.
CONAGUA (Comisión Nacional del Agua), 2015c, Actualización de la disponibilidad media anual de agua anual en el acuífero Allende-Piedras Negras (0501) Estado de Coahuila (on line): Subdirección General Técnica, Gerencia de Aguas Subterráneas. Subgerencia de Evaluación y Ordenamiento de acuíferos, <https://www.gob.mx/cms/uploads/attachment/file/102840/DR_0501.pdf> query date: august 13th 2020.
Demirel, S., Roubinet, D., Irving, J., Voytek, E., 2018, Characterizing Near-Surface Fractured-Rock Aquifers: Insights Provided by the Numerical Analysis of Electrical Resistivity Experiments: Water, 10(9), 2-20.
Eguiluz de Antuñano, S., 2001, Geologic evolution and gas resources of the Sabinas Basin in Northeastern Mexico, in Bartolini, C., Buffler, R.T., Cantú-Chapa, A. (eds)., The western Gulf of Mexico Basin: Tectonics, sedimentary basins, and petroleum systems: American Association of Petroleum Geologists Memoir, 75, 241-270.
Goldhammer, R.K., 1999, Mesozoic sequence stratigraphy and paleogeographic evolution of northeast Mexico, in Bartolini, C., Wilson, J.L., Lawton, T.F. (eds.), Mesozoic sedimentary and Tectonic History of North-Central Mexico: Boulder, Colorado, EUA: Geological Society of America Special Paper, 340, 1-58.
González-Sánchez, F., Puente-Solís, R., González-Partida, E., Camprubí, A., 2007, Estratigrafía del Noreste de México y su relación con los yacimientos estratoligados de fluorita, barita, celestina y Zn-Pb: Boletín de la Sociedad Geológica Mexicana, 59, 43-62.
Gottardi, R., Mason, S.L., 2018, Characterization of the natural fracture system of the Eagle Ford Formation (Val Verde County, Texas): American Association of Petroleum Geologists Bulletin, 102(10), 1963-1984.
Kovalevsky, V.S., Kruseman, G.P., Rushton, K.R., 2004, Groundwater studies. An international guide for hydrogeological investigations: Paris, IHP-VI, Series on Groundwater No. 3. UNESCO. 430 pp.
Nimnate, P., Thitimakorn, T., Choowong, M., Hisada, K., 2017, Imaging and locationg paleo-channels using geophysical data from meandering system of the Mun River, Khorat Plateau, Northeastern Thailand: Open Geosciences, 9(1), 675-688.
Obiadi, I.I., Onwuemesi, A.G., Anike, O.L., Obiadi, C.M., Ajaegwu, N.E., Anakwuba, E.K., Akpunonu, E.O., Ezim, E.O., 2012, Imaging subsurface fracture characteristics using 2D electrical resistivity tomography: International Research Journal of Engineering Science, Technology and Innovation, 1(4), 103-110.
Padilla y Sánchez, R.J., 1986, Post-Paleozoic Tectonics of Northeast Mexico and its role in the evolution of the Gulf of Mexico: Geofísica Internacional, 25, 157-206.
Raghunath, H.M., 2006, Hydrology: principles, analysis and design. Second edition: New Delhi, India, New Age International (P), Ltd., Publishers, 463 pp.
Ratnakumari, Y., Rai, S.N., Thiagarajan, S., Kumar, D., 2012, 2D electrical resistivity imaging for delineation of deeper aquifers in a part of the Chandrabhaga river basin, Nagpur District, Maharashtra, India: Current Science, 102(1), 61-69.
Robert, T., Dassargues, A., Brouyère, S., Kaufmann, O., Hallet, V., Nguyen, F., 2011, Assessing the contribution of electrical resistivity tomography (ERT) and self-potential (SP) methods for a water well drilling program in fractured/karstified limestones: Journal of Applied Geophysics, 75, 42-53.
Sanchez, R., Rodriguez, L., Tortajada, C., 2018, Transboundary aquifers between Chihuahua, Coahuila, Nuevo Leon and Tamaulipas, Mexico, and Texas, USA: Identification and Categorization: Journal of Hydrology: Regional Studies, 20, 74-102.
Santiago-Carrasco, B., Ontiveros-Escobedo, E., Martínez-Rodríguez, L., Herrera-Monreal, J.C., 2008, Carta geológico-minera Piedras Negras H14-10. Coahuila: Servicio Geológico Mexicano, Cartas geológicas de México serie 1: 250,000, 1 map with text.
Sequeira-Gómez, L., Escolero-Fuentes, O., 2010, The application of electrical methods in exploration for ground water resources in the River Malacatoya sub-basin, Nicaragua: Geofísica Internacional, 49(1), 27-41.
SGM (Servicio Geológico Mexicano), 2003, Carta geológico-minera Nueva Rosita Coahuila G14-13: Cartas geológicas de México serie 1: 50,000, 1 map with text.
Srinivasamoorthy, K., Sarma, VS., Vasantavigar, M., Vijayaraghavan, K., Chidambaram, S., Rajivganthi, R., 2009, Electrical imaging techniques for groundwater pollution studies: a case study from Tamil Nadu state, south India: Earth Sciences Research Journal, 13(1), 30-39.
Szalai, S., Kovács, A., Kuslits, L., Facskó, G., Gribovszki, K., Kalmár, J., Szarka, L., 2018, Characterisation of Fractures and Fracture Zones in a Carbonate Aquifer Using Electrical Resistivity Tomography and Pricking Probe Methodes: Journal of Geoscience and Environment Protection, 6(4), 1-21.
Tangdamrongsub, N., Steele-Dunne, S., Gunter, B.C., Ditmar, P.G., Sutanudjaja, E.H., Sun, Y., Xia, T., Wang, Z., 2017, Improving estimates of water resources in a semi-arid region by assimilating GRACE data into the PCR-GLOBWB hydrological model: Hydrology and Earth System Sciences, 21, 2053-2074.
Telford, W.M., Geldart, L.P., Sheriff, R.E., 1990, Applied Geophysics. Second Edition: Cambridge University Press. 792 pp.
Winker, C.D., Buffler, R.T., 1988, Paleogeographic evolution of earlydeep-water Gulf of Mexico and margins, Jurassic to Middle Cretaceous (Comanchean): American Association of Petroleum Geologists Bulletin, 72, 318-346.
WMO (World Meteorological Organization), 2009, Guide to Hydrological Practices. Volume II. Management of water resources and application of hydrological practices: Switzerland, WMO-No. 168, Sixt edition, 302 pp.