How to cite: García-Martínez, R., Carrillo-Chávez, A., Torres-Jardón, R., Ramírez-Guzmán, A., López-Carrasco, M., 2020, Chemical composition of rainwater collected from 2006 to 2009 in Mexico City and at a rural site in Morelos State, south central Mexico: Revista Mexicana de Ciencias Geológicas, v. 37, núm. 1, p. 1-8.
REVISTA MEXICANA DE CIENCIAS GEOLÓGICAS
v. 37, núm. 1, 2020, p. 1-8
DOI: http://dx.doi.org/10.22201/cgeo.20072902e.2020.1.1101
Chemical composition of rainwater collected from 2006 to 2009 in Mexico City and at a rural site in Morelos State, south central Mexico
Rocío García-Martínez1, Alejandro Carrillo-Chávez2,*, Ricardo Torres-Jardón1, Alejandro Ramírez-Guzmán3, and Moisés López-Carrasco1
1 Centro de Ciencias de la Atmósfera, Universidad Nacional Autónoma de México,
Ciudad Universitaria, Mexico City, 04510, Mexico.
2 Centro de Geociencias, Universidad Nacional Autónoma de México,
Campus Juriquilla, Querétaro, 76230, Mexico.
3 Unidad Académica de Ciencias de la Tierra, Universidad Autónoma de Guerrero,
Ex hacienda de San Juan Bautista s/n; Taxco el Viejo Guerrero, 40223, Mexico.
ABSTRACT
The objective of the study was to evaluate the chemical composition of rainwater in urban and suburban areas of central Mexico to identify the possible sources of rainwater contamination. The rainwater was collected at Universidad Nacional Autónoma de Mexico, Campus Ciudad Universitaria (CU), in the southern part of Mexico City at 2200 meters above sea level (m a.s.l.). CU has many green areas with high to moderate traffic densities where air quality presents serious problems of pollution by particulate matter. The other sampling site is a forested rural area (Tlalnepantla), State of Morelos, Mexico, a suburban area 86 km to the south of Mexico City. A total of 145 rainwater samples were collected in the rain period from 2006 to 2009. The ions analyzed were the following: SO42-, NO3-, Cl-, HCO3-, Na+, K+, Ca2+, Mg2+, NH4+ and H+. Ammonium was the most abundant cation in both sites and is one of those responsible for the neutralization of acidic compounds in the atmosphere. The relative abundance of the inorganic anions present in the rainwater was in the following order: SO42- > NO3- > Cl-, for the alkaline metals the order was Ca2+ >Mg2+ > Na+ > K+ and Ca2+ >Mg2+ >K+ >Na+ for CU and Morelos, respectively. A correlation analysis shows a strong positive correlation among the ions, indicating that the most important source was anthropogenic. Air mass back trajectories were associated with the SO42-, Ca2+, Mg2+, NH4+ and H+ concentrations observed on each rainy day. Four factors were used in the statistic analysis and was weighted within each factor. Weights greater than 0.5 are considered to be significant components of each factor. The four factors explain 84.7 % of the total variance of all of the data for CU and 66.9 % for Morelos. All of these factors were associated with all of the analyzed ions.
Air pollutant back trajectories were used to understand atmospheric transport and to identify the origins and pathways of air masses influencing the concentrations of the measured ions in rainwater.
Keywords: rainwater; ions; air pollution; back trajectories; Mexico.
RESUMEN
El objetivo de este trabajo fue el de evaluar la composición química del agua de lluvia en áreas urbanas y suburbanas del centro de México a fin de identificar las posibles fuentes de contaminantes en agua de lluvia. El agua de lluvia fue colectada en el Campus de la Universidad Nacional Autónoma de Mexico (Ciudad Universitaria, CU) al sur de la Ciudad de México y a 2200 m s.n.m. CU tiene muchas áreas verdes con tráfico moderado a intenso en donde la calidad del aire presenta serios problemas de contaminación por partículas. El otro sitio de muestreo es el área boscosa de Tlanepantla, Estado de Morelos, México, un área suburbana a 86 km al sur de la Ciudad de México. Un total de 145 muestras de agua de lluvia fueron colectadas en las temporadas de lluvia del 2006 al 2009. Los iones analizados fueron: SO42-, NO3-, Cl-, HCO3-, Na+, K+, Ca2+, Mg2+, NH4+ y H+. El amonio fue el catión más abundante en ambos sitios y es unos de los iones responsables de neutralizar compuestos ácidos en la atmósfera. La abundancia relativa de aniones inorgánicos presentes en el agua de lluvia se presenta en el siguiente orden: SO42- > NO3- > Cl-, para metales alcalinos el orden es: Ca2+ >Mg2+ > Na+ > K+, y Ca2+ >Mg2+ >K+ >Na+ para CU y Morelos, respectivamente. Un análisis de correlación muestra una fuerte correlación positiva entre los iones, lo cual indica que la fuente más probable es antropogénica. Las trayectorias de masas de aire fueron asociadas con las concentraciones de SO42-, Ca2+, Mg2+, NH4+ y H+ observadas durante cada día de lluvia. Se usaron cuatro factores en el análisis estadístico y a este se le dio un peso específico con cada factor. Los pesos específicos mayores de 0.5 son considerados como componentes significantes de cada factor. Los cuatro factores explican el 84.7 % de la variación total de los datos de la Ciudad de México y 66.9 % para Morelos. Todos los factores son asociados con los iones analizados. Las trayectorias de contaminantes fueron usadas para entender el transporte atmosférico e identificar origen y direcciones de las masas de aire que influyen las concentraciones de los iones medidos.
Palabras clave: agua de lluvia; iones; contaminación de aire; trayectorias de masas de aire; México.
Manuscript received: december 6, 2018
Corrected Manuscript received: may 17, 2019
Manuscript accepted: may 30, 2019
INTRODUCTION
Since the middle of the 20th century, studies of rainwater composition have been among the most important conducted by atmospheric scientists in the northern and southern Hemispheres. Rainwater plays an important role in cleaning the atmosphere, since by means of this process removes the greatest amount of contaminants present in it. The chemical composition of rainwater varies from one place to another and from one region to another, due to the influence of local sources, both natural and anthropogenic. Determining its chemical composition is important to understand the function of the transport of soluble components in the atmosphere, to understand the contribution of different sources of air pollution, and to establish the degree of environmental deterioration of a region. Therefore, the chemistry of wet deposits can provide insights into the temporal development of the atmosphere and its degree of contamination. Similarly, it can be used as an indicator in the evaluation of natural processes against anthropogenic influences (Niu et al., 2014). The chemistry of wet and dry deposits has continuously changed, as published papers have demonstrated (Aherne and Farrell, 2002; Baez et al., 1997. Studies of rainwater have been widely reported, with the purpose of knowing the degree of environmental deterioration of a site, mainly focused on the study of acid rain and alkaline dust neutralization mechanisms (Das et al., 2010). Therefore, the precipitation chemistry in both rural areas and urban areas has been subject to interesting studies in the last few decades (Galloway et al., 1983; Lee et al., 2000; Lacaux et al., 1992; Sanusi et al., 1996). In addition to the analysis of ion contents (NO3-, SO42-, NH4+, Cl-, Na+, Ca2+, Mg2+, K+) reported in this study, trace metals have been quantified due to their adverse environmental and human health effects and these results will be published elsewhere. Metals such as Pb, Cd, and Hg accumulate in the biosphere and may be toxic to living systems (Barrie et al., 1987; Galloway et al., 1982). Anthropogenic particles such as heavy metals are readily dissolved at the low pH values found in polluted rainwater (Migon et al., 1997); therefore, their bioavailability is enhanced. In Mexico City, the chemical composition of rainwater has been continuously studied due to the heavy air pollution that characterizes the metropolitan area of Mexico City. So, rainwater composition is a very important way to monitor the scavenging atmospheric processes of particulate matter and gases in the area (Liu et al., 2012). The purpose of the study was to evaluate the chemical composition of rainwater in urban and suburban areas of central Mexico and to identify the possible sources of rainwater contamination.
Sampling sites
The urban site was located at the Centro de Ciencias de la Atmósfera (CCA) located at 19°19’34” N latitude and 99°10’55” W longitude inside the Universidad Nacional Autónoma de México, campus Ciudad Universitaria (CU), in the southern part of Mexico City at 2200 m a.s.l. The University has many green areas with high to moderate traffic densities. The other sampling site is a forested rural area (Tlalnepantla), State of Morelos, Mexico, located at 19°00’28” N latitude and 98°59´51” W longitude in the southern foothills of the Eje Neovolcánico at 2060 m a.s.l. Tlalnepantla borders on the north with the metropolitan area of Mexico City and the State of Mexico, on the southeast with Totolapan, the west with Tepoztlán, the south with Tlayacapan, and Cuautla City is further to the south and has moderate human activity. Pine and caducifolious forests lie to northeast and the northwest of the sampling site, with light vehicular traffic (Figure 1).
A total of 145 rainwater samples were collected using automatic wet/dry precipitation collectors (Andersen, General Metal Works, Inc.) for inorganic ions on the weekends from mid-May to the end of October, which is the rainy season in central Mexico, during the 2006 to 2009 period. The samples were collected in standard high-density polyethylene (HDPE) buckets. To minimize contamination, the collector lid arms were Teflon-coated and the original aluminum cover and plastic-covered pad were replaced with a Teflon lid and pad. In the rural area Tlalnepantla, the sampling was done in passive collectors that consisted of a funnel attached to a high-density polyethylene (HDPE) bottle supported by a rod at a height of 1.5 m above ground level (Galloway et al., 1983). After the rainy events, the collection buckets were tightly sealed with polyethylene covers and were sent to the chemical laboratory of the CCA. At the laboratory, all collected samples were filtered through 0.40 µm polycarbonate membrane filters, which were leached with 300 ml of deionized water. For the ion analysis, samples were poured into HDPE bottles, capped, and kept at 4 °C until analysis. The buckets used to collect the rain samples for major ion analysis and the flask and storage bottles were previously washed, brushed, and rinsed with distilled water and then deionized water (DI). The sample was treated under a clean hood (EPA) maintained at positive pressure to limit the introduction of contaminants from the laboratory.
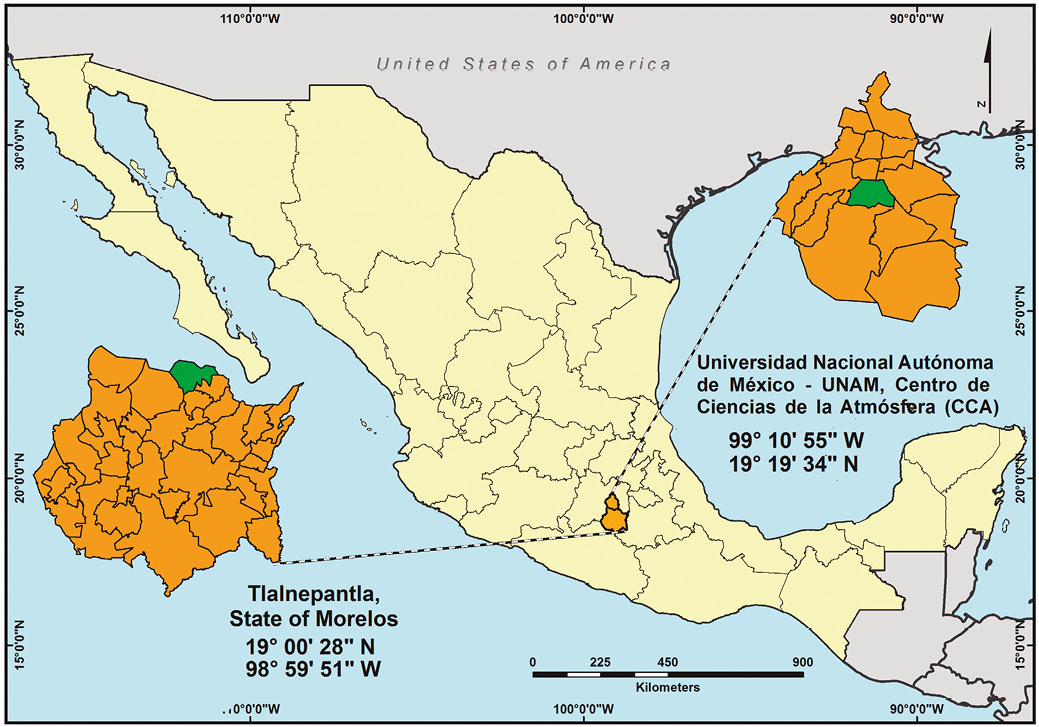
Figure 1. Localization of sampling sites at Centro de Ciencias de la Atmósfera, Universidad Nacional Autónoma de México, campus Ciudad Universitaria in Mexico City, and Tlalnepantla, State of Morelos, Mexico.
Table 1a. Volume weighted mean concentrations (VWMC), standard deviation of the VWMC (SDVWMC), Minimum (Min) and Maximum (Max) concentrations (µeqL-1) of ions in rainwater collected in Ciudad Universitaria (CU) for the period 2006-2009. EC= electric conductivity. |
|||||||||||||
Ion |
SO42- |
Cl- |
NO3- |
Na+ |
K+ |
Ca2+ |
Mg2+ |
NH4+ |
H+ |
pH |
EC (µScm-1) |
Alkalinity CaCO3 (mgL-1) |
Rain amount (mm) |
CU-2006 (N=21) |
|||||||||||||
WMC |
58.85 |
7.62 |
49.49 |
3.29 |
2.23 |
39.18 |
3.90 |
93.62 |
4.60 |
5.61 |
35.20 |
57.14 |
37.11 |
SDVWMC |
10.80 |
1.70 |
9.71 |
0.74 |
0.49 |
7.44 |
0.75 |
17.85 |
1.37 |
1.29 |
3.38 |
15.90 |
16.17 |
Min |
17.29 |
2.25 |
20.00 |
0.07 |
0.15 |
11.95 |
1.07 |
43.89 |
0.08 |
4.74 |
1.70 |
0.02 |
5.50 |
Max |
207.29 |
20.85 |
190.00 |
40.39 |
31.41 |
245.40 |
31.48 |
247.22 |
18.20 |
7.10 |
47.60 |
0.08 |
88.40 |
CU-2007 (N=21) |
|||||||||||||
VWMC |
90.61 |
12.75 |
57.18 |
4.58 |
2.64 |
49.95 |
5.04 |
109.87 |
16.58 |
5.23 |
49.70 |
25.00 |
33.67 |
SDVWMC |
20.25 |
2.89 |
12.19 |
1.41 |
0.67 |
10.62 |
1.20 |
21.86 |
7.53 |
1.11 |
2.50 |
7.21 |
11.73 |
Min |
25.21 |
3.94 |
19.29 |
0.07 |
0.15 |
10.60 |
0.26 |
55.56 |
0.40 |
4.03 |
25.50 |
1.7 |
5.00 |
Max |
328.96 |
54.93 |
225.00 |
22.78 |
14.50 |
201.60 |
22.30 |
329.44 |
93.33 |
6.40 |
56.80 |
19.80 |
|
CU-2008 (N=19) |
|||||||||||||
VWMC |
70.37 |
10.11 |
44.07 |
2.51 |
0.84 |
33.56 |
3.26 |
99.14 |
11.32 |
5.20 |
22.60 |
37.53 |
29.21 |
SDVWMC |
16.12 |
2.34 |
9.70 |
0.60 |
0.36 |
7.41 |
21.82 |
3.69 |
3.69 |
1.38 |
6.69 |
5.31 |
13.49 |
Min |
32.71 |
4.51 |
15.81 |
0.07 |
0.15 |
6.75 |
0.26 |
46.11 |
0.18 |
4.49 |
2.16 |
1.82 |
2.20 |
Max |
70.37 |
10.11 |
44.07 |
2.51 |
0.84 |
33.56 |
3.26 |
99.14 |
11.32 |
5.20 |
24.00 |
31.30 |
63.20 |
CU-2009 (N=16) |
|||||||||||||
VWMC |
59.97 |
6.04 |
58.43 |
3.86 |
1.63 |
47.14 |
4.74 |
100.59 |
9.91 |
5.70 |
31.10 |
59.48 |
36.85 |
SDVWMC |
16.12 |
1.69 |
18.31 |
1.26 |
0.56 |
14.80 |
1.42 |
28.54 |
6.12 |
1.57 |
5.50 |
5.06 |
14.55 |
Min |
13.75 |
1.13 |
12.10 |
0.07 |
0.15 |
8.53 |
0.26 |
36.04 |
0.10 |
4.30 |
1.20 |
16.28 |
1.90 |
Max |
159.14 |
21.44 |
163.88 |
25.88 |
15.14 |
236.83 |
21.06 |
267.22 |
50.12 |
7.02 |
13.23 |
77.44 |
60.00 |
Table 1b. Volume weighted mean concentrations (VWMC), standard deviation of the VWMC (SDVWMC), Minimum (Min) and Maximum (Max) concentrations (µeqL-1) of ions in rainwater collected in Tlalnepantla, Morelos for the period 2006-2009. EC= electric conductivity. |
|||||||||||||
SO42- |
Cl- |
NO3- |
Na+ |
K+ |
Ca2+ |
Mg2+ |
NH4+ |
H+ |
pH |
EC (µScm-1) |
Alkalinity CaCO3 (mgL-1) |
Rain amount (mm) |
|
Morelos-2006 (N=15) |
|||||||||||||
VWMC |
33.28 |
9.38 |
20.72 |
0.21 |
0.58 |
9.66 |
0.87 |
38.04 |
17.36 |
5.08 |
14.62 |
30.50 |
49.68 |
SDVWMC |
9.15 |
2.79 |
6.03 |
0.08 |
1.19 |
2.52 |
0.23 |
10.60 |
5.27 |
1.58 |
2.01 |
3.01 |
21.00 |
Min |
5.69 |
1.48 |
5.00 |
0.07 |
0.15 |
2.46 |
0.26 |
9.44 |
1.95 |
4.06 |
1.74 |
1.78 |
5.80 |
Max |
102.93 |
68.17 |
55.00 |
2.74 |
5.96 |
41.10 |
4.26 |
108.98 |
87.10 |
5.71 |
11.20 |
29.10 |
82.30 |
Morelos 2007 (N=18) |
|||||||||||||
VWMC |
34.30 |
7.41 |
19.25 |
0.32 |
0.42 |
7.65 |
0.75 |
36.95 |
20.42 |
4.84 |
9.97 |
17.01 |
54.29 |
SDVWMC |
11.32 |
3.04 |
5.97 |
0.13 |
0.14 |
2.58 |
0.26 |
11.06 |
7.65 |
1.44 |
1.32 |
2.03 |
26.43 |
Min |
7.72 |
1.13 |
5.00 |
0.07 |
0.15 |
0.50 |
0.26 |
8.33 |
1.48 |
4.15 |
4.56 |
3.21 |
1.50 |
Max |
103.87 |
47.89 |
62.86 |
2.65 |
5.37 |
44.50 |
4.43 |
143.89 |
70.17 |
5.83 |
9.69 |
11.45 |
108.30 |
Morelos-2008 (N=16) |
|||||||||||||
VWMC |
36.37 |
11.01 |
20.02 |
0.36 |
0.24 |
6.68 |
0.64 |
41.74 |
21.16 |
4.79 |
18.52 |
29.40 |
55.92 |
SDVWMC |
10.47 |
3.10 |
5.06 |
0.16 |
0.09 |
1.19 |
0.21 |
10.87 |
7.18 |
1.42 |
2.01 |
1.02 |
23.58 |
Min |
4.58 |
5.63 |
6.13 |
0.07 |
0.15 |
0.50 |
0.26 |
10.00 |
1.07 |
4.15 |
5.07 |
1.41 |
1.90 |
Max |
72.71 |
23.66 |
92.26 |
12.17 |
8.75 |
66.15 |
10.08 |
151.67 |
70.79 |
5.97 |
15.67 |
25.45 |
100.40 |
Morelos-2009 (N=19) |
|||||||||||||
VWMC |
36.61 |
6.94 |
23.70 |
0.68 |
0.49 |
26.92 |
0.91 |
51.04 |
8.71 |
5.32 |
13.87 |
67.21 |
53.05 |
SDVWMC |
8.14 |
1.88 |
5.20 |
0.19 |
0.17 |
16.85 |
0.25 |
11.58 |
2.78 |
1.70 |
1.18 |
0.27 |
29.52 |
Min |
4.58 |
1.13 |
5.16 |
0.07 |
0.15 |
0.50 |
0.26 |
12.75 |
0.50 |
4.03 |
2.16 |
2.40 |
3.30 |
Max |
156.02 |
92.53 |
120.17 |
9.53 |
6.93 |
81.44 |
9.13 |
252.25 |
99.33 |
6.30 |
14.20 |
56.32 |
96.80 |
Chemical analysis
The rainwater pH was measured by using an Orion 960 auto chemistry system within 24 h after the samples were collected. SO42-, NO3- and Cl- were analyzed by non-suppressed ion chromatography, and NH4+ was measured by suppressed chromatography using a Perkin Elmer instrument equipped with an isocratic LC pump 250 and a ConductoMonitor III model conductivity detector. Na+, K+, Ca2+, and Mg2+ were analyzed by flame atomic absorption spectrometry with a GBC 932AA at 589, 766.5, 422.7 and 282.5 nm, respectively, with hollow cathode lamps (Photron Super lamp). For the background correction and analysis, a deuterium super lamp was used. The detection limits in µeq L-1 were 4.58, 2.74, 1.13, 2.33, 0.074, 0.16, 0.5 and 0.13 for SO42-, NO3-, Cl-, NH4+, Na+, K+, Ca2+ and Mg2+, respectively. The conductance was measured with an YSI 3200 conductivity instrument. The alkalinity was measured using the Grand`s titration method with an Orion 960 autochemistry system, and the HCO3- concentration was computed using the equation described by Stumm and Morgan (1981). High-purity, traceable standards from the National Institute of Standards and Technology (NIST) were used to obtain the calibration curves for each of the major ions.
Quality control
The blanks of all glass and plastic were analyzed. The concentrations of blanks were below the major ion detection limits. The data quality for the collected samples was verified by comparison of the measured and calculated conductivity and by ionic balance evaluation, defined by Peden et al. (1986) as follows: Ion Percent Difference=[(Cations-Anions)/Cations+Anions)]×100 and Conductance Percent Difference=[(Calculated Conductance /Measured Conductance)]×100.
RESULTS AND DISCUSSION
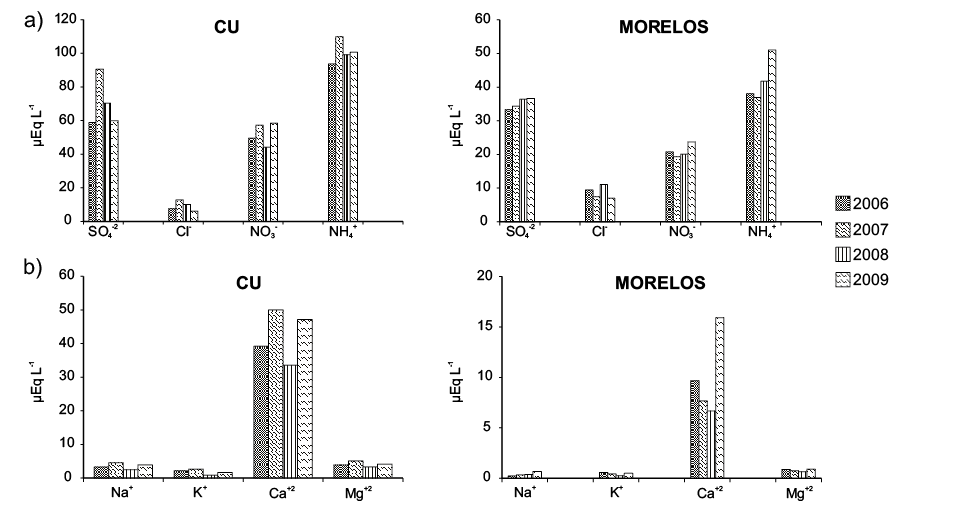
The volume-weighted mean concentrations (VWMC) in µeqL-1 and the standard deviations of the VWMC (SDVWMC) of the ions in the rainwater measured at the CU and Morelos sampling sites are shown in Tables 1a and 1b. These tables show that the ion concentrations were higher in CU than in Morelos over four years; these results were expected considering the heavy air pollution that is prevalent in the Mexico City metropolitan area. However, higher rain amounts also occurred in Morelos and contributed to the dilution of the ion concentrations. The most abundant cation in both sites was NH4+ (Figure 2) and is one of those responsible for the neutralization of acidic compounds, forming from the neutralization reactions of ammonia (NH3) with the acids present in the atmosphere. The relative abundance of the inorganic anions present in the rainwater was in the following order: SO42- > NO3- > Cl-, for the alkaline metals the order were Ca2+ >Mg2+ > Na+ > K+ and Ca2+ >Mg2+ >K+ >Na+ for CU and Tlalnepantla, respectively (Figure 2). Values of pH corresponding to acid rain were observed at both sites. For CU, 20 % of the analyzed samples presented acid values and for Morelos more than 40% of the samples presented a pH lower than 5.6, characteristic of a forest and cultivation area. This acidity is acceptable because it is very close to the acidity of natural rain (in equilibrium with CO2). Lower pH values would imply acidification and soil degradation (Xu et al., 2011; Shrestha et al., 2013).
Figure 2. Variations of volume weighted mean concentrations (VWMC) of anions and alkaline metals in rainwater collected during the rainy seasons of years 2006-2009 in a) Ciudad Univeristaria (CU), b) Morelos.
Statistics
Statistical analysis was performed with the integrated results of each analyzed ion. In this study, Statistica/W Stat Soft program (StatSoft, version 11, 2010) was used for the data treatment and analysis and involved three steps: a) experimental data set arrangement and correlation efficient matrix building, b) data exploration and description by principal component analysis, and c) principal component factor loadings.
Correlation analysis
Spearman Rank Order correlation coefficients were calculated for the total ions. Table 2 show the matrix correlations for the different ions. If the coefficient between ions is high, then the source of emission is the same for both. Strong correlations were found between SO42-, Cl-, NO3-, Ca2+, Mg2+, Na+, K+ and NH4+ from Morelos and CU; these ions were assumed to be correlated because they are completely soluble in rainwater. The strong correlation between Ca2+, Mg2+, Na+, and K+ also indicates a contribution from crustal material.
Tables 2. Spearman rank correlation among the average concentration of inorganic ions in rainwater samples collected during 2006-2009. |
|||||||||
SO42- |
Cl- |
NO3- |
NH4+ |
Na+ |
K+ |
Ca2+ |
Mg2+ |
H+ |
|
Ciudad Universitaria (CU) |
|||||||||
SO42- |
1.00 |
||||||||
Cl- |
0.738 |
1.00 |
|||||||
NO3- |
0.790 |
0.694 |
1.00 |
||||||
NH4+ |
0.277 |
0.154 |
0.283 |
1.00 |
|||||
Na+ |
0.628 |
0.625 |
0.611 |
0.338 |
1.00 |
||||
K+ |
0.711 |
0.623 |
0.817 |
0.281 |
0.563 |
1.00 |
|||
Ca2+ |
0.755 |
0.692 |
0.636 |
0.391 |
0.620 |
0.585 |
1.00 |
||
Mg2+ |
0.758 |
0.618 |
0.732 |
0.374 |
0.697 |
0.637 |
0.796 |
1.00 |
|
H+ |
0.188 |
0.281 |
0.194 |
0.159 |
0.158 |
0.235 |
0.210 |
0.215 |
1.00 |
Tlalnepantla, Morelos |
|||||||||
SO42- |
1.00 |
||||||||
Cl- |
-0.099 |
1.00 |
|||||||
NO3- |
0.687 |
-0.132 |
1.00 |
||||||
NH4+ |
0.614 |
-0.088 |
0.621 |
1.00 |
|||||
Na+ |
0.522 |
0.117 |
0.531 |
0.598 |
1.00 |
||||
K+ |
0.636 |
-0.074 |
0.554 |
0.546 |
0.574 |
1.00 |
|||
Ca2+ |
0.741 |
-0.175 |
0.669 |
0.669 |
0.505 |
0.462 |
1.00 |
||
Mg2+ |
0.665 |
-0.229 |
0.604 |
0.635 |
0.470 |
0.391 |
0.678 |
1.00 |
|
H+ |
0.246 |
0.087 |
0.149 |
0.223 |
0.029 |
0.128 |
0.195 |
0.069 |
1.00 |
Bold numbers are significant at p<0.05, N=77 for the CU samples, and p<0.05, N=68, for the samples from Tlalnepantla, Morelos. |
Factor analysis
To assess the relationships between the concentrations of the studied elements, a Principal Component Analysis was applied to normalize the varimax rotation. The varimax rotation aimed to maximize the variances of the squared normalization factor loadings across the variables for each factor and to facilitate interpretation. This method is the most widely used (StatSoft, version 11, 2010). For the CU data, the principal component analysis was applied (Table 3), and four factors that explained 84.7 % of the total variance were chosen. In factor 1 (38.2 %), NH4+ and SO42- are associated with high loading and can be related to anthropogenic sources. In factor 2 (22.2 %), there is an association with NO3-. The two ions with highest loadings are Ca2+ and H+, suggesting that Ca2+ has a crustal origin, while H+ shows an association with the atmospheric acids (sulfuric and nitric), and NO3- from anthropogenic sources. In factor 3, Cl- and Ca2+ are associated with high loadings with a moderate loading for SO42-; these results indicate anthropogenic origins for Cl- and SO42- and a crustal origin for Ca2+. From the principal component analysis, four factors were chosen to explain 66.9% of the total variance of all of the data from Morelos (Table 3). The first factor (35% of the total variance), suggests no association of the species NO3-, SO42- , and NH4+ with anthropogenic sources and that Ca2+ is mainly of crustal origin. The second factor (13.2%) highlights the associations of Cl-, Mg2+ and Na+, although these associations suggest marine origins. In the cases of the Mexico City and Morelos sampling sites, a marine origin is ruled out because both sampling sites are in a valley located at approximately 450 km from both the Pacific Ocean and Gulf of Mexico; therefore, the association of Cl-, Na+ and Mg2+ in Morelos suggests an origin from soil dust and industrial emissions. Factor 3, with a variance of 10.4%, shows the association of NH4+, NO3- and SO42- with a high loading, which indicates anthropogenic sources, while the moderate loadings of Ca2+ and K+ point to crustal origins.
Acidifying and neutralizing components
Significant correlations between the sum of acidifying ions (SO42-+NO3-+Cl-) and the sum of neutralizing components (Ca2++NH4++Mg2++K+) were observed at CU (Figure 3a) and Morelos (Figure 3b). The pH values from CU were higher than the values from Morelos and varied between 5.67 to 6.11, which apparently indicate that the acidity of the precipitation was neutralized by the alkaline particles and NH4+; because the pH values in Morelos were acidic (4.28 to 5.27), neutralization most likely did not occur because of the forested characteristics of the sampling site. It is known that the acidity of rain is mainly determined by strong acids, e.g., H2SO4 and HNO3 (Overrein et al., 1980. SO42- y NO3- are the main acidifying components of rain and enable the fractional acidity (FA) to be calculated: FA=H+/(SO42-+NO3-) (Balasubramanian et al., 2001). If the ratio is equal to one, the acidity generated by these strong acids is likely not to be neutralized at all. Figures 4a and 4b show the variation in FA in the CU and Morelos rainwater from 2006 to 2009. In Mexico City from 2006 to 2009, a significant increase in FA (r = 0.47) was observed, indicating a small decrease in acidification. In Morelos, a significant decrease occurred, which indicates an increase in acidity. The relative contribution of NO3- to the acidification was calculated using the NO3-/(NO3-+SO42-) ratio. In CU, the four-year average ratio was 0.48, indicating that 48 % of the rain acidity was due to NO3- and 52 % was due to SO42-. In Morelos, the average ratio was 0.26, 26 % of the acidity was due to NO3-, and 74 % was due to SO42-. Table 1a and Table 1b show that NO3- was the third most abundant ion in CU and Morelos after NH4+ and SO42-, representing an important contribution to the rain acidity in CU and even more so in Morelos.
Some authors have associated the pH of rain with the dissolution of ions contained in aerosols. The pH of CU samples were higher than the values of Morelos samples and varied between 5.43 to 5.0 in the four years reported; indicating a slightly acid atmosphere, influenced by SO42-, Cl- and NO3- in 86 %. The rainwater acidity could make some ions highly soluble. The ion NH4+ is the most important neutralizing species, though the concentrations of Ca2+ + Mg2+ + K+ are additional contributions to the atmospheric neutralizing process (Table 4) (Ceron et al., 2005; Zhang et al., 2012: Cerqueira et al., 2014, Zhang et al., 2018).
Table 3. Factor statistical analyses for all data and all variables for rainwater samples. Factor loading normal varimax extraction. |
||||
Variable |
Factor 1 |
Factor 2 |
Factor 3 |
Factor 4 |
Ciudad Universitaria (CU) |
||||
NH4+ |
0.83 |
-0.13 |
-0.11 |
0.12 |
Cl- |
0.67 |
0.42 |
0.81 |
0.09 |
NO3- |
-0.07 |
0.77 |
0.11 |
0.12 |
SO42- |
0.83 |
-0.02 |
0.73 |
0.26 |
Ca2+ |
0.08 |
0.89 |
0.94 |
0.40 |
Mg2+ |
0.59 |
-0.09 |
1.02 |
0.23 |
Na+ |
0.06 |
0.55 |
0.10 |
-0.05 |
K+ |
0.38 |
0.22 |
0.14 |
-0.20 |
H+ |
0.08 |
0.89 |
-0.09 |
0.57 |
% Total variance |
38.2 |
22.2 |
14.5 |
9.8 |
Tlalnepantla, Morelos |
||||
NH4+ |
0.05 |
-0.08 |
0.84 |
0.12 |
Cl- |
-0.02 |
0.85 |
-0.05 |
0.09 |
NO3- |
0.10 |
0.13 |
0.80 |
0.12 |
SO42- |
0.09 |
0.06 |
0.81 |
0.26 |
Ca2+ |
0.23 |
0.22 |
0.63 |
0.40 |
Mg2+ |
0.16 |
0.67 |
0.35 |
0.23 |
Na+ |
-0.03 |
0.83 |
0.13 |
-0.05 |
K+ |
0.14 |
0.24 |
0.59 |
-0.20 |
H+ |
0.31 |
0.006 |
0.41 |
0.65 |
% Total variance |
35.0 |
13.2 |
10.4 |
8.3 |
Principal components (bold numbers are significant at > 0.5).
|
Figure 3. Correlations between the sum of acidifying and that of neutralizing components for data of rainwater collected during the rainy seasons of years 2006-2009 in (a) Ciudad Univeristaria (CU) and (b) Morelos, sampling site.
Back trajectories
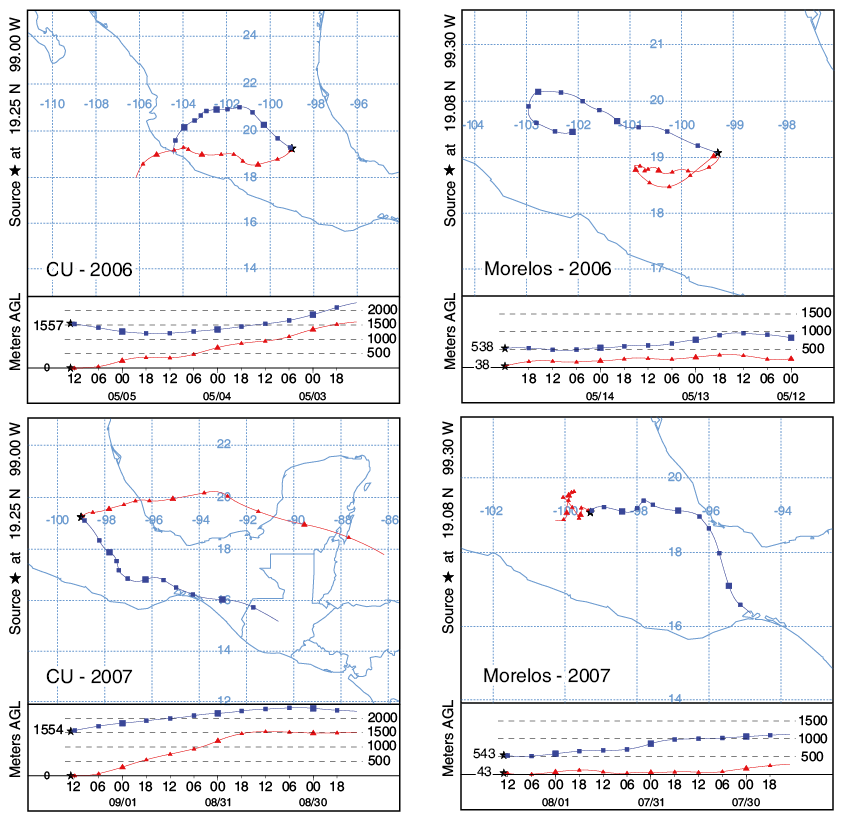
There are many influences on precipitation chemistry. The transport paths of air masses before rainfall provide useful knowledge to evaluate and understand the chemical analysis of precipitation. Therefore, it is important to determine the variations in rainwater chemical composition by back trajectory analysis to estimate the sources of the emissions. The complex topography of the Mexico City valley and the surrounding areas could produce inconsistencies when coupling the rainwater ionic concentrations to the air mass back trajectory analysis. Therefore, a detailed analysis of the wind flow patterns based on reliable soundings at various altitudes above ground level in different zones of the Mexico City Valley is needed to obtain an accurate, high-resolution air mass back trajectory analysis. Due to journal space, only two trajectories per year are shown in Figure 5 for the CU and Morelos sampling sites. According to the back trajectory analysis (Figure 5) the prevailing wind directions from where the strongest wind originates are from W-SW, NW-W, and NE-N.
Figure 4. Variation of Fractional Acidity (FA) for data of rainwater samples collected during the rainy seasons of years 2006-2009 in (a) Ciudad Univeristaria (CU) and (b) Morelos.
Table 4. Typical composition of rainwater from several locations compared to that reported in this study for two localities in central Mexico. |
|||||
Ions |
Coastala |
Mountainb |
Dustyc |
Urband |
This study CU–Morelos |
SO42- |
28.1 |
32.64 |
14.2 |
156.9 |
69.95 – 35.14 |
Cl- |
149.9 |
11.56 |
17.3 |
15.1 |
9.13 – 8.68 |
NO3- |
67.9 |
3.63 |
16.0 |
35.1 |
52.29 – 20.92 |
Na+ |
118.6 |
2.52 |
25.0 |
24.4 |
6.56 – 0.39 |
K+ |
3.1 |
----- |
7.12 |
20.1 |
1.83 – 0.43 |
Ca2+ |
12.9 |
50.19 |
39.6 |
62.1 |
42.45 – 12.72 |
Mg2+ |
26.0 |
7.73 |
24.1 |
9.9 |
4.08 – 0.79 |
NH4+ |
6.8 |
11.36 |
20.8 |
89.6 |
100.8 – 41.94 |
pH |
4.16 |
6.08 |
5.77 |
5.0 |
5.43 – 5.0 |
EC (µScm-1) |
----- |
14.17 |
11.3 |
35.9 |
34.65 – 14.24 |
*Alkali(CaCO3) (mgL-1) |
69.8 |
------ |
125.0 |
----- |
44.78 – 36.03 |
aCeron et al. (2005), bN. Zhang et al. (2012), cCerqueira et al. (2014), Zhang et al. (2018). EC= electric conductivity; *Alkali= Alkalinity.
|
Figure 5. Backward modeled trajectories corresponding to the 2006-2009 period to each site: Ciudad Universitaria (CU) and Morelos. The blue squares and line indicate the modeled trajectories for a higher atmosphere circulation and the red triangles and line indicate the modeled trajectories for a lower atmosphere circulation for both sites (CU and Morelos). The vertical scale on the lower plot are meters above ground level, and the horizontal scale indicates the date
CONCLUSIONS
The results presented in this study suggest that the rainwater in the studied areas is strongly influenced by local anthropogenic sources and by terrestrial sources. Hence, it is important to have more studies over longer time periods in order to understand the chemical composition of rainwater of sites under different meteorological conditions, and with different topographical and orographic characteristics. The detailed analysis of rainwater composition at two sampling sites in Mexico City and a rural woody zone in Morelos State has led to the following conclusions:
- Higher rainwater acidity in Mexico City is due to the local washout of the atmosphere.
- Chemical composition of rainwater collected at a rural wooded zone is affected by soil dust and/or fertilisers used in the nearby gardens. The consequence is a partial neutralisation of rainwater in some of the samples, but in general neutralization did not occur at the Morelos site (forested area). This is particularly evident when the pH medians at both sites are compared.
- NH4+ has the highest concentration in both places, followed by SO42-, NO3- and Cl-.
- Ca2+ was the most abundant of the alkaline metals in both locations. The rainwater is slightly acid to neutral, with strong correlations between Ca2+ and other ionic species, revealing that the acidity is, in part, being neutralized (specially in the CU area). This indicates some inputs of alkaline species to rainwater in both regions.
-The average pH of samples higher than 5.6 is due to high loadings of calcium ions in the form of CaCO3. This may be due to a high load of alkaline dust particle by numerous quarry hills and factories.
-Calculated correlation coefficients indicate strong positive correlations between all of the analyzed ions. Higher concentrations of all anions and alkaline metals were found in Mexico City, which was expected because the atmosphere of this city is one of most polluted of the world.
-The back trajectories were estimated to understand the influences on the precipitation chemistry and its variation. The transport paths of the air masses before rainfall provided useful knowledge to evaluate and understand the analysis of the precipitation chemical compositions. These trajectories were calculated for both sites at CU and Morelos.
ACKNOWLEDGEMENTS
We thank M.C. María Carolina Muñoz Torres, Higicel Domínguez, Manuel García, Wilfrido Gutiérrez, Miguel A, Flores, Delibes Flores and Miguel A. Robles for their technical support and assistance with this manuscript.
REFERENCES
Aherne, J., Farrell, E., 2002, Deposition of sulphur, nitrogen and acidity in precipitation over Ireland: chemistry, spatial distribution and long-term trends: Atmos Environ, 36, 1379-1389.
Ceron, R.M., Ceron, J.G., Córdova, A.V., Zaval, J., Muriel, M., 2005, Chemical composition of precipitation at coastal and marine sampling sites in Mexico: Global Nest Journal, 7(2), 212-221.
Cerqueira, M.R.F., Pinto, M.F., Derossi, I.N., Esteves, W.T., Santos, M.D.R., Matos, M.A.C., Lowinsohn, D., Matos, R.C., 2014, Chemical characteristics of rainwater at a southeastern site of Brazil: Atmospheric Pollution Research. 5, 253-261.
Báez A.P., Belmont, R.D.. Padilla, H.G., 1997, Chemical composition of precipitation at two sampling sites in Mexico: a 7-year study: Atmospheric Environment, 31(6), 915-925.
Balasubramanian, R., Victor, T., Chun, N., 2001, Chemical and statistical analysis of precipitation in Singapore: Water Air Soil Poll, 130, 451-456.
Barrie, L., Lindberg, S., Chan, W., Ross, H., Arimoto, R., Church, T., 1987, On the concentration of trace metals in precipitation: Atmospheric Environment (1967), 21(5), 1133-1135.
Das, N., Das, R., Chaudhury, G.R., Das, S.N., 2010, Chemical composition of precipitation at background level: Atmospheric Research, 95, 108-113.
Galloway, J.N., Linkens, G.E, Keene, W.C., Miller, J.M., 1982, The composition of precipitation in remote areas of the world: Journal of Geophysical Research, 87, 8771-8776.
Galloway, J.N., Knap, A.H., Church, T.M., 1983, The composition of western Atlantic precipitation using shipboard collectors: Journal of Geophysical Research: Oceans - AGU Publications, 88, 10859-10864.
Lacaux, J., Delmas, R., Kouadio, G., Cros, B., Andreae, M., 1992, Precipitation chemistry in the Mayombe forest of equatorial Africa: Journal of Geophysical Research: Atmospheres, 97, 6195-6206.
Lee, B. K., Hong, S. H., Lee, D. S., 2000, Chemical composition and precipitation and wet deposition of major ions on the Korean Peninsula: Atmospheric Environment, 34(4), 563-575, https://doi.org/10.1016/S1352-2310(99)00225-3
Liu, X.H., Wai, K.M., Wang, Y., Zhou, J., Li, P.H., Guo, J., Xu, P.J., Wang, W.X., 2012, Evaluation of trace elements contamination in cloud/fog water at an elevated mountain site in Northern China: Chemosphere, 88, 531-541.
Migon, C., Journel, B., Nicolas, E., 1997, Measurement of trace metal wet, dry and total atmospheric fluxes over the Ligurian Sea: Atmospheric Environment, 31(6), 889-896, https://doi.org/10.1016/S1352-2310(96)00242-7
Niu, H., He, Y., Lu, X.X., Shen, J., Du, J., Zhang, T., Pu, T., Xin, H., Chang, L., 2014, Chemical composition of rainwater in the Yulong Snow mountain region, Southwestern China: Atmospheric Research, 144, 195-206.
Overrein, L.N., Seip, H.M., Tollan, A., 1980, Acid precipitation-effects on forest and fish; final report of the SNSF project 1972–1980: Oslo, SNSF Project, Research Report FR 19/80, 175 pp.
Sanusi, A., Wortham, H., Millet, M., Mirabel, P., 1996, Chemical composition of rainwater in eastern France: Atmospheric Environmental. 30(1), 59-71.
Shrestha, S., Pandey, V.P., Yoneyama, Y., Shrestha, S., Kazama, F., 2013, An evaluation of rainwater quality in Kathmandu Valley, Nepal: Sustainable Environment Research, 23, 341-350.
StatSoft Inc., 2010, STATISTICA version 11: Tulsa, Oklahoma, USA, data analysis software system.
Stumm, W., Morgan, J.J., 1981, Aquatic Chemistry: An Introduction Emphasizing Chemical Equilibrium in Natural Waters, second edition: New York, USA, John Wiley and Sons, 780 pp.
Peden, M.E., Bachman, S.R., Brennan, C.J., Demir, B., James, K.O., Kaiser, B.W., Lockard, J.M., Rothert, J.E., Sauer, J., Skowron, L.M., Slater, M.J., 1986, Development of standard methods for the collection and analysis of precipitation: Champaign, Illinois, US Environmental Protection Agency, Environmental Monitoring and Support Laboratory, ISWS Contract Report 381.
Xu, H., Bi, X.H., Feng, Y.C., Lin, F.M., Jiao, L., Hong, S.M., Liu, W.G., Zhang, X.Y., 2011, Chemical composition of precipitation and its sources in Hangzhou, China: Environmental Monitoring and Assessment, 183, 581-592.
Zhang, N., He, Y., Cao, J., Ho, K., Shen, Z., 2012, Long-term trends in chemical composition of precipitation at Lijiang, southeast Tibetan Plateau, southwestern China: Atmospheric Research, 106, 50-60.
Zhang, Liuyi, Qiao, Baoqing., Wang, Huanbo, Tian, Mi, Cui, Jian, Fu, Chuan, Huang, Yimin, Yang, Fumo, 2018, Chemical Characteristics of Precipitation in a Typical Urban Site of the Hinterland in Three Gorges Reservoir, China: Journal of Chemistry, ID 2914313, 10 pp, https://doi.org/10.1155/2018/2914313